TUI User Guide
Table of Contents
- Overview
- Starting TUI
- Process Selector
- TUI Interface Layout
- Global Shortcuts
- Ten Major Views Explained
- TUI-Exclusive Features
- TUI vs CLI Comparison
- Usage Tips
- Troubleshooting
- Permission Requirements
- Summary
Overview
Peeka provides a fully-featured Text User Interface (TUI) built on the Textual framework. TUI mode offers a more intuitive interactive experience than CLI, supporting real-time data streaming, interactive operations, colored output, and keyboard navigation.
Use Cases:
- Interactive Diagnostics: Frequent command switching and real-time data viewing
- Real-time Monitoring: Observe performance metrics, log output, memory changes
- Visual Analysis: Tree structure display of call chains, color-coded performance data
- Exploratory Debugging: Uncertain which command to use, explore step-by-step through TUI
Starting TUI
Method 1: Direct Launch
peeka
Method 2: Python Module Method
python -m peeka.tui
Launch Options
# Use custom theme
peeka --theme dracula

# List available themes
peeka --list-themes
Available Themes:
default- Textual default themenord- Nord color schemedracula- Dracula color schemegruvbox- Gruvbox color schememonokai- Monokai color schemesolarized-light- Solarized Lightsolarized-dark- Solarized Dark
Process Selector
Since v0.1.16, the startup process selector shows both Peeka-managed target agents and attachable Python processes:
alivetargets are shown by target ID; regular Python processes appear asattachable- Wide terminals show Name, PID, State, Python, Command, and Created; narrow terminals keep Name, State, and Created
- The filter input matches name, command, PID, or state
rrefreshes the list,Enterselects the current row,ycopies the attach log, andescape/qexits- stale, failed, detached, and unknown rows are shown for status awareness but are not selectable attach targets
TUI Interface Layout
After starting TUI, the interface is divided into the following areas:
Area Descriptions
- Header: Display TUI title and current time
- PID Status: Display currently attached target process PID
- Tab Bar: Display all available view tabs
- View Content: Content area of the currently active view
- Footer: Display global shortcut hints
Global Shortcuts
| Shortcut | Function | Description |
|---|---|---|
1 |
Dashboard View | Switch to dashboard |
2 |
Watch View | Switch to function observation |
3 |
Trace View | Switch to call chain tracing |
4 |
Stack View | Switch to call stack capture |
5 |
Monitor View | Switch to performance monitoring |
6 |
Memory View | Switch to memory analysis |
7 |
Logger View | Switch to logger management |
8 |
Inspect View | Switch to object inspection |
9 |
Threads View | Switch to thread management |
0 |
Top View | Switch to Function Profiler (Function profiler) |
? |
Help | Show help information (available in some views) |
escape / q |
Back / Exit | Exit in Dashboard, return to Dashboard in other views |
Ten Major Views Explained
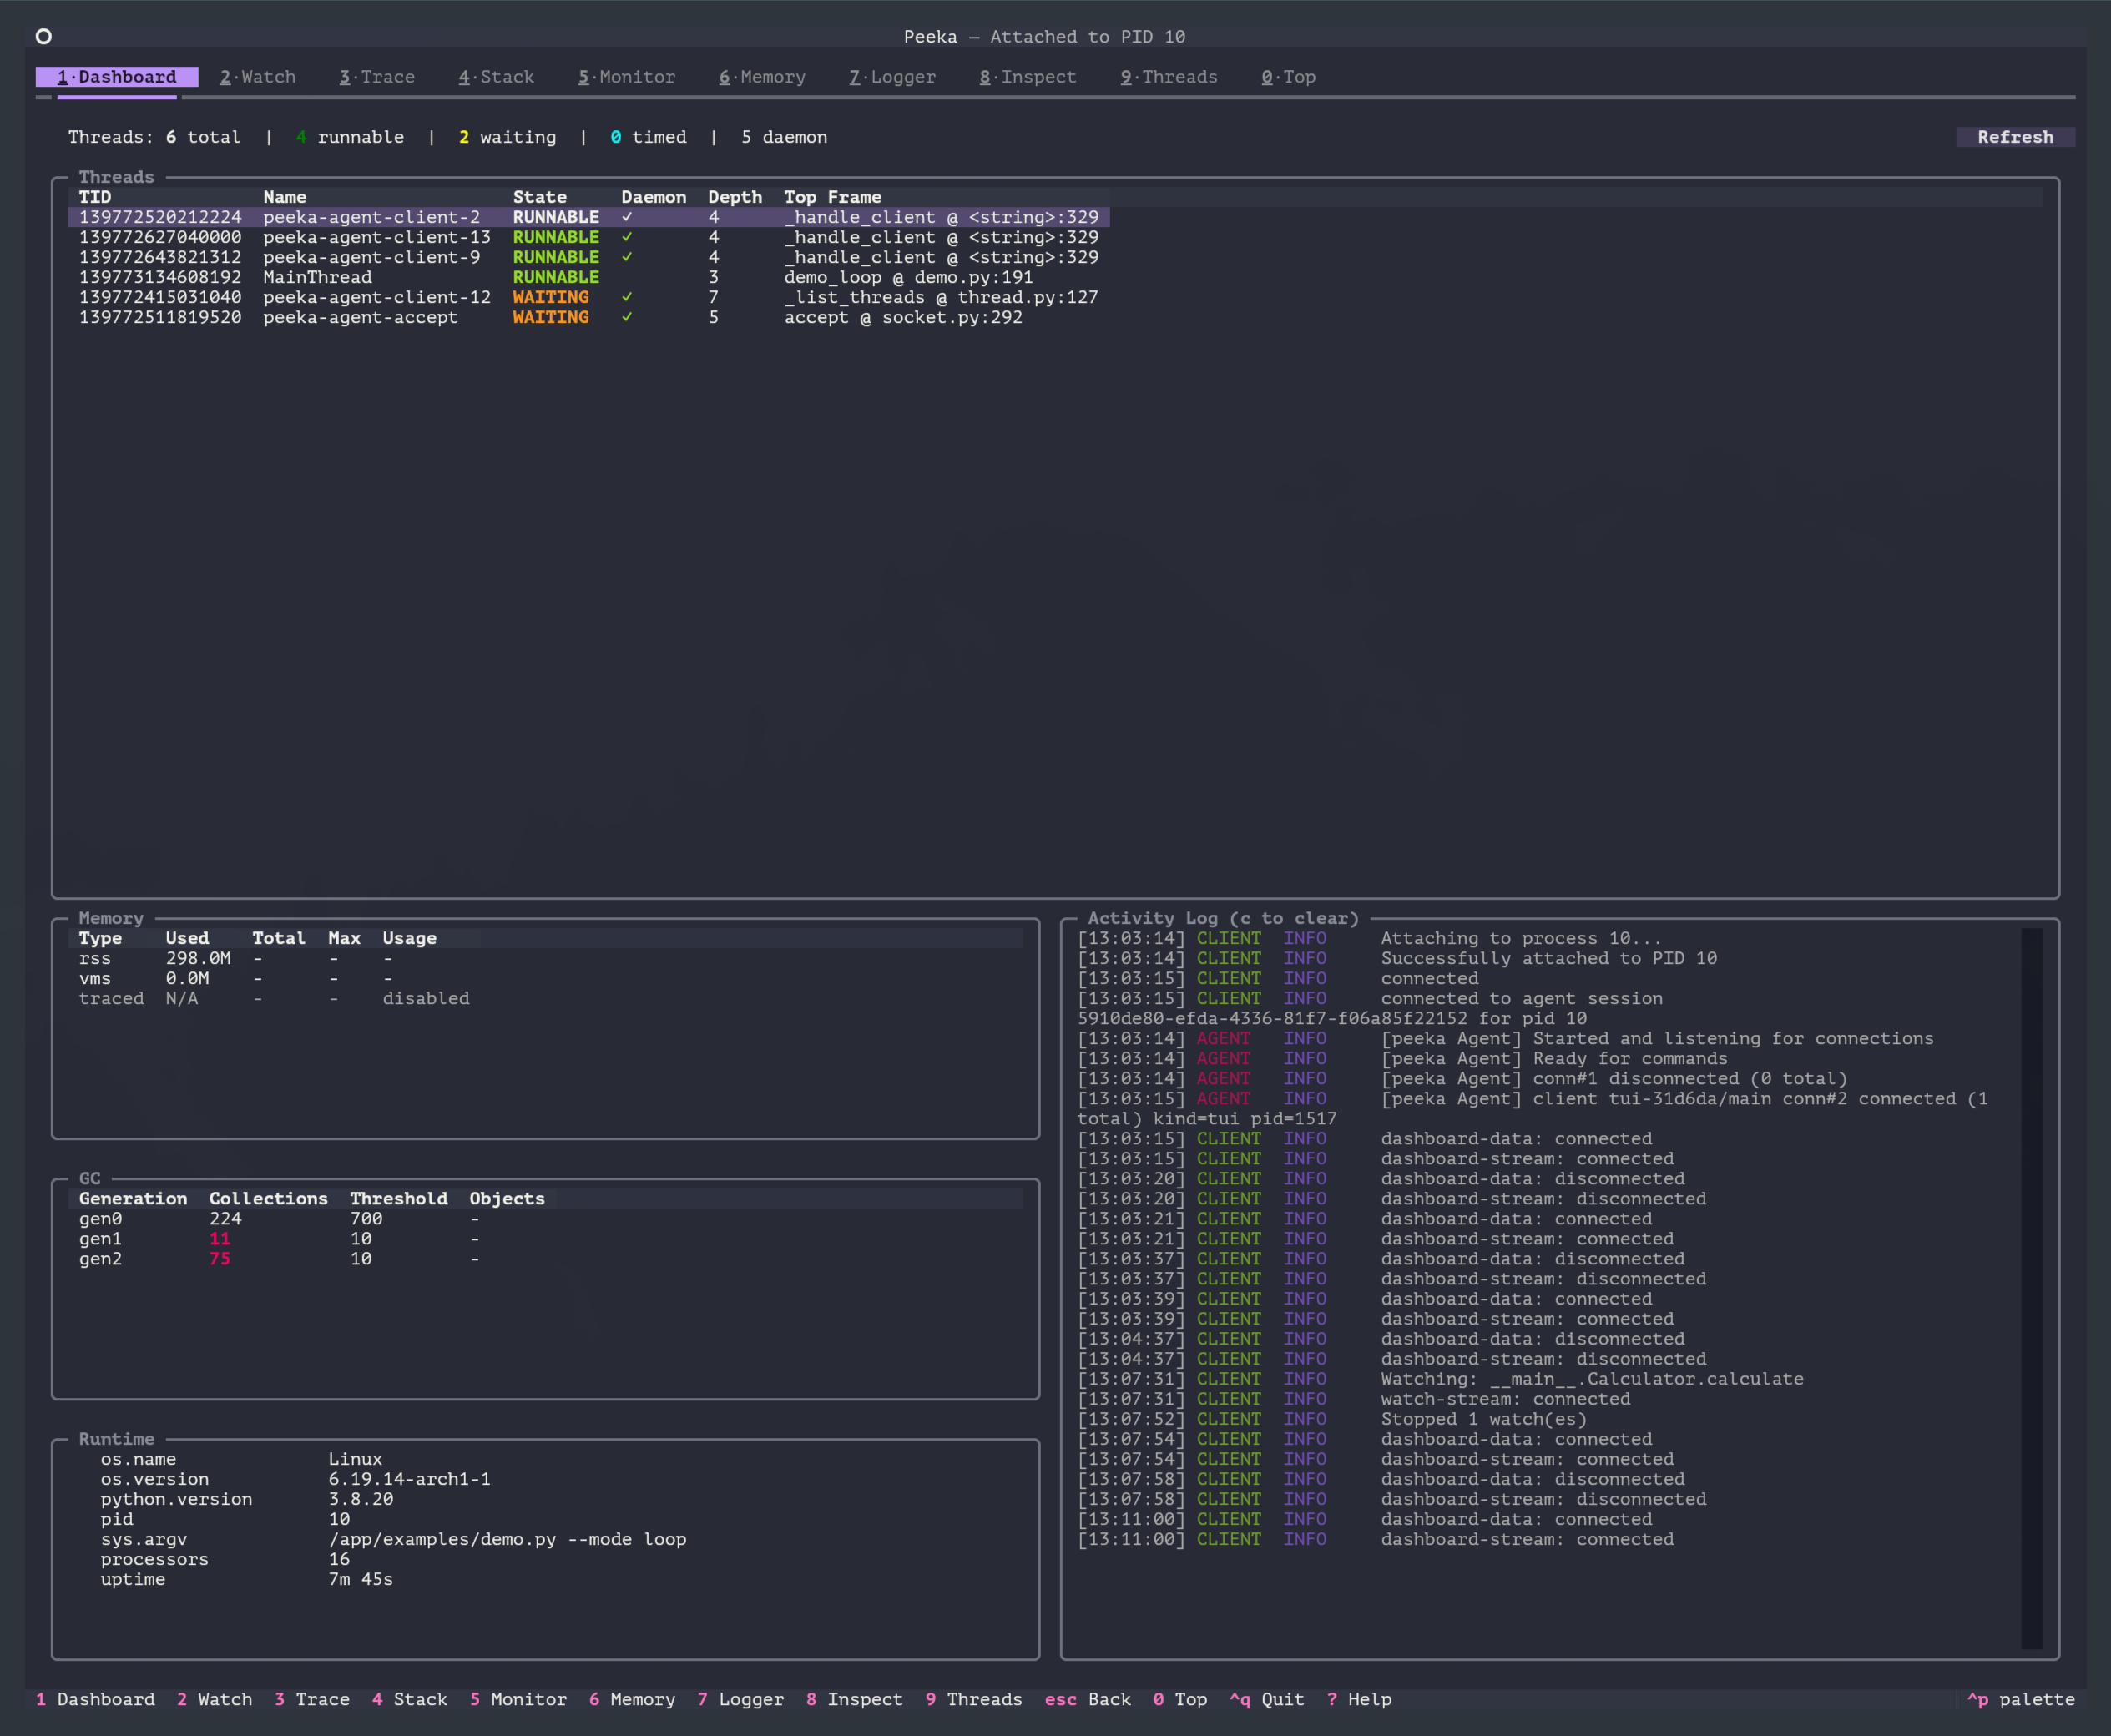
1. Dashboard View (1 key)
Function: Real-time diagnostic overview for the target process
Features:
- Thread count and state summary
- Thread list with daemon markers and current top frame
- Memory, GC, and runtime information overview
- Activity Log showing client and agent events in real time
- Refresh support for the current process snapshot
Usage:
- Start TUI and attach to the target process
- Review thread, memory, GC, and runtime state
- Use Activity Log to confirm connection and command execution status
- Press other view shortcuts to switch to dedicated views
Suitable Scenarios: Quickly checking process health, thread state, and diagnostic session connectivity
Dashboard Activity Log (v0.1.13)
The Dashboard Activity Log component received the following improvements in v0.1.13:
- History replay on reconnect (
15463f9): Activity history is replayed when reconnecting to restore context - Wrapping preserved (
86aad2e): Activity log wrapping setting survives reconnects - Focus cleared before tab shortcuts (
7677e29): Input focus is cleared before tab shortcuts to prevent interference - Lazy-initialize hidden tabs (
59dbe4d): Hidden tabs skip refresh operations, reducing CPU usage
Attach Activity Log (v0.1.16)
- The process selector attach log can be copied with
y, which helps preserve failure diagnostics - After a successful attach, Dashboard replays the attach activity summary so the connection setup context remains visible
Runtime metadata (v0.1.17)
The Dashboard runtime info panel now appends three extra rows sourced from the patch-status command:
Gevent: gevent state inside the target process (patched/imported/none, etc.)Backend: active trace backend (e.g.profilerorwrapper_only)Downgraded: whether a runtime downgrade was triggered (e.g. by gevent); the reason is appended in parentheses when present
These rows update on every Dashboard refresh, making it easy to tell - without switching views - whether trace/watch behavior is affected by monkey patching.
2. Watch View (2 key)
Function: Observe function call parameters, return values, exceptions, timing
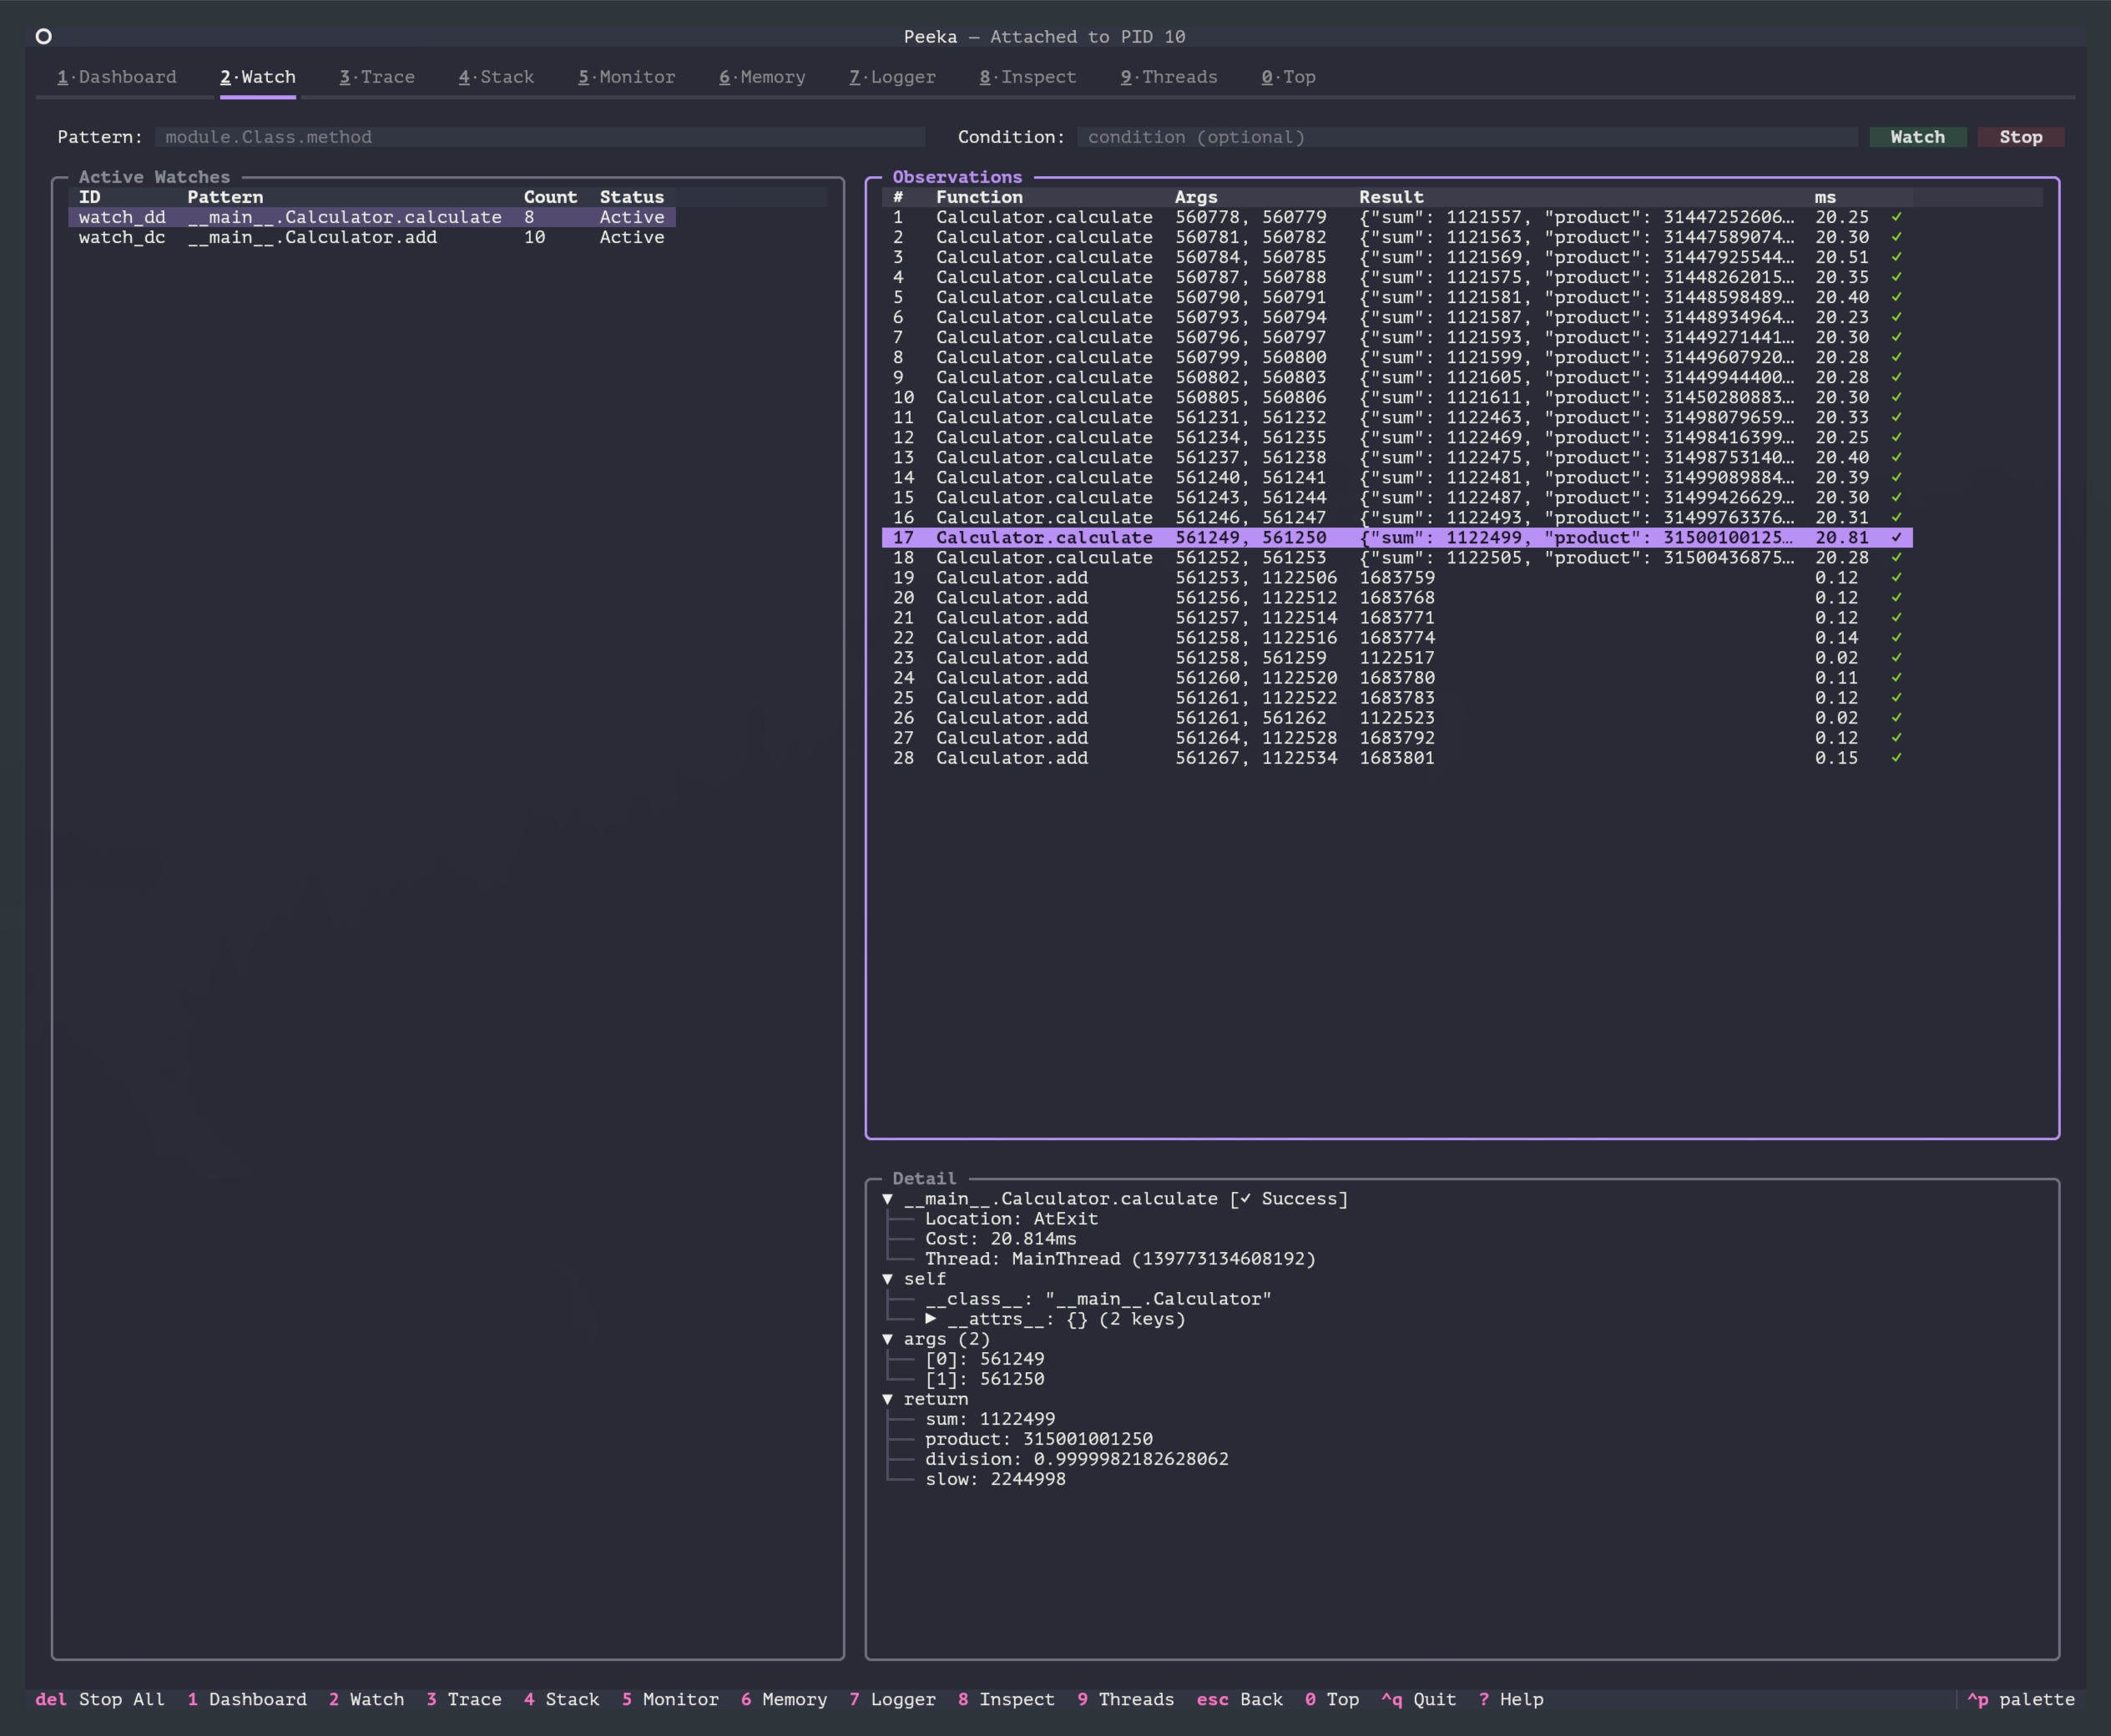
Features:
- Real-time streaming updates (observation data continuously displayed)
- Supports condition filtering
- Supports observation point control (-b / -e / -s / -f)
- Colored output (success=green, exception=red)
- Display call count, cumulative time
Interactive Operations:
- Enter function pattern (e.g.,
module.Class.method) - Set observation count (-n parameter)
- Set condition expression (–condition)
- Press Enter to start observation
- Press Delete to stop observation
Output Format:
- Table view: Display key fields (params, returnObj, cost, success)
- Detailed view: JSON format showing complete data
Runtime metadata banner (v0.1.17)
When the Watch view opens it automatically calls patch-status to fetch the target process runtime state. When gevent, a non-default backend, or a downgrade is detected, a compact banner is rendered just below the controls, for example:
Gevent: patched Backend: wrapper_only (downgraded: gevent_patched_runtime)
The banner stays hidden when there is no signal to display (default CPython, no gevent). The information is derived from the runtime_meta field added to the watch_started event, which makes it easy to spot behavioral differences in gevent-style environments.
3. Trace View (3 key)
Function: Trace function call chains, showing hierarchical relationships and timing of method calls
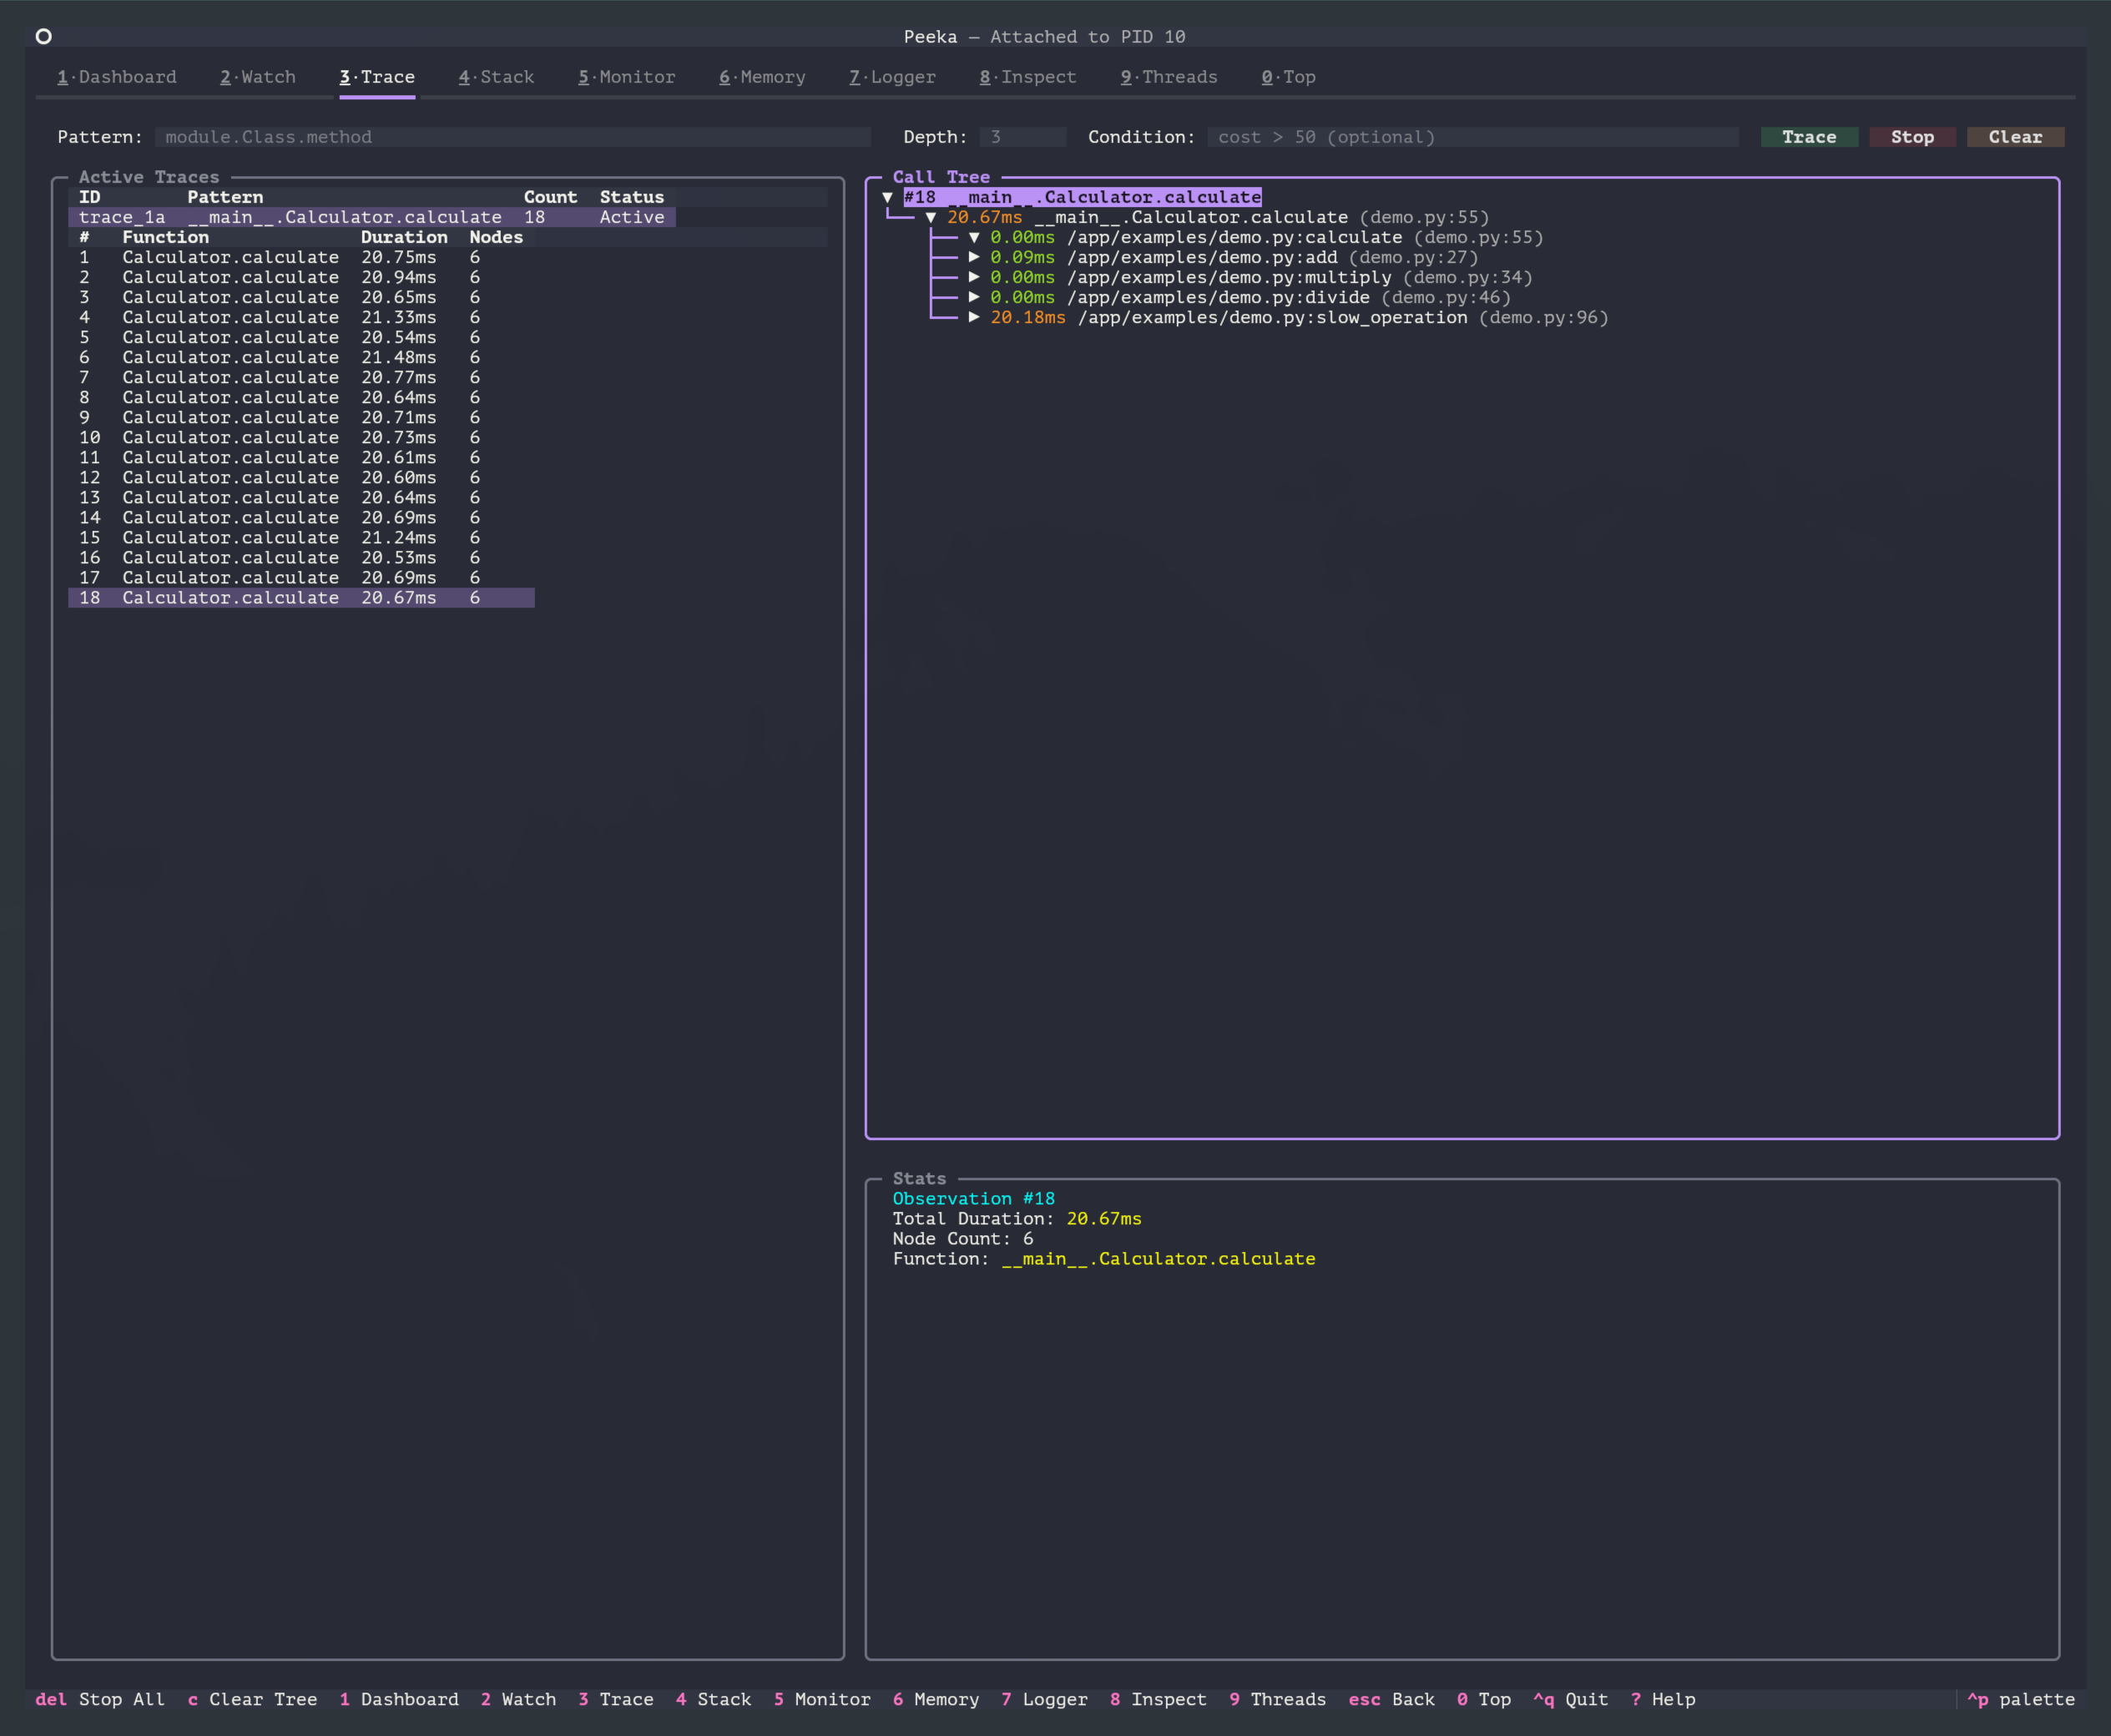
Features:
- Tree structure display: Visualize call hierarchy
- Color-coded timing:
- Green: < 10ms
- Yellow: 10-100ms
- Red: ≥ 100ms
- Real-time streaming updates: Each call displayed immediately
- Supports expand/collapse: Interactive tree nodes
- Depth limit: Control tracing depth (-d parameter)
Interactive Operations:
- Enter function pattern
- Set trace depth (default 3 levels)
- Set skip builtin functions (–skip-builtin)
- Press Enter to start tracing
- Press Delete to stop tracing
- Click nodes to expand/collapse (mouse support)
Output Example: The Trace view displays call chains and each node’s timing as an expandable tree.
Backend and gevent state (v0.1.17)
Each trace observation’s stats panel now appends a Backend: ... Gevent: ... line after Node Count / Function:
- When trace runs on the full
profilerbackend it showsBackend: profiler (full). - When the target is gevent-patched and trace has degraded to
wrapper_onlyit showsBackend: wrapper_only Gevent: patched, matching the gevent compatibility note in the trace command docs.
This information is sourced from the new runtime_meta field on trace responses, helping explain why trace no longer reports a full recursive call tree in some runtimes.
4. Stack View (4 key)
Function: Capture complete call stack when function is called
Features:
- Display complete call chain (from entry to current function)
- Supports condition filtering
- Real-time streaming updates
- Display file path, line number, function name
Interactive Operations:
- Enter function pattern
- Set stack depth (–depth parameter)
- Set condition expression
- Press Enter to start capture
- Press Delete to stop capture
Output Format:
- Each call displays one stack snapshot
- Complete path from call entry to target function
5. Monitor View (5 key)
Function: Periodically output function performance statistics (call count, success rate, response time)
Features:
- Periodic updates (configurable interval)
- Display aggregate statistics:
- Total call count
- Success count / failure count
- Average time / min time / max time
- Supports monitoring multiple functions simultaneously
- Real-time chart display (optional)
Interactive Operations:
- Enter function pattern
- Set update interval (–interval parameter, in seconds)
- Set cycle count (-c parameter, -1 for infinite)
- Press Enter to start monitoring
- Press Delete to stop monitoring
Output Example:
Function: module.func
  Total Calls: 1523
  Success: 1500 (98.5%)
  Failed: 23 (1.5%)
  Avg Time: 12.3ms
  Min Time: 0.5ms
  Max Time: 250.8ms
6. Memory View (6 key)
Function: Analyze process memory usage and memory allocation
Features:
- Memory overview (total memory, RSS, heap size)
- Top N memory allocation tracking
- Group by file / line number
- Supports manual GC trigger
- Memory snapshot comparison
Interactive Operations:
- View memory overview (overview operation)
- Start memory tracking (start operation)
- View Top N allocations (top operation)
- Trigger garbage collection (gc operation)
- Stop memory tracking (stop operation)
Common Operation Shortcuts:
r: Refresh datag: Trigger GCt: Toggle tracking status
7. Logger View (7 key)
Function: Dynamically adjust Python logger log levels
Features:
- List all loggers and their current levels
- Modify log levels at runtime (DEBUG / INFO / WARNING / ERROR)
- No need to restart target process
- Supports pattern matching (e.g.,
myapp.*)
Interactive Operations:
- List all loggers (list operation)
- Get specific logger level (get operation)
- Set logger level (set operation)
- Supports pattern matching (–pattern)
Output Example:
Logger: myapp.database
  Level: INFO
  Effective Level: INFO
  Handler: StreamHandler

Logger: myapp.api
  Level: DEBUG
  Effective Level: DEBUG
  Handler: FileHandler
8. Inspect View (8 key)
Function: Runtime object inspection and expression evaluation
Features:
- Execute Python expressions (safe sandbox)
- Inspect object attributes
- View variable values
- Supports
locals()/globals()inspection
Interactive Operations:
- Enter Python expression (e.g.,
len(my_list)) - Enter object path (e.g.,
module.MyClass.attr) - Press Enter to execute
- View JSON-formatted results
Security Restrictions:
- Disables
eval/exec/__import__ - Read-only access (cannot modify objects)
- Safe sandbox based on
simpleeval
9. Threads View (9 key)
Function: List all threads, inspect thread status and stacks
Features:
- Real-time thread list updates
- Display thread status (RUNNABLE / WAITING / TIMED_WAITING)
- Display thread ID, name, daemon flag
- Click thread to view complete stack
- Supports filtering by status, sorting by field
Interactive Operations:
- View all threads (list mode)
- Click thread to view details (detail mode)
- Filter by status (RUNNABLE / WAITING / TIMED_WAITING)
- Sort by field (tid / name / state)
Output Format:
- Table view: Thread list (tid, name, state, stack_depth)
- Detail view: Complete stack frames (filename, lineno, funcname, locals_keys)
Shortcuts:
r: Refresh thread listEnter: View selected thread detailsescape: Return to list view
10. Function Profiler (Function profiler) (0 key)
Function: Function-level sampling performance profiler (similar to py-spy top)
Features:
- Real-time performance rankings
- Display CPU usage percentage (own / total)
- Display function time (own_time / total_time)
- Sampling mode, performance overhead < 5%
- Supports sorting by different fields
- Color coding (red=high CPU, yellow=medium, green=low)
Interactive Operations:
- Set sampling interval (–interval parameter, default 10ms)
- Set display cycles (–cycles parameter)
- Select sort field (own / total / own-time / total-time)
- Press Enter to start profiling
- Press Delete to stop profiling
- Press
cto clear statistics (reset)
Output Example:
Function                     Own%   Total%  Own Time  Total Time
───────────────────────────────────────────────────────────────
compute_matrix              45.3%   58.7%   0.453s    0.587s
multiply                    12.8%   13.4%   0.128s    0.134s
log_result                   8.2%    8.9%   0.082s    0.089s
Shortcuts:
r: Refresh datas: Switch sort fieldEnter: Start performance profilingDelete: Stop performance profilingc: Clear statistics data (reset)
TUI-Exclusive Features
Compared to CLI mode, TUI provides the following exclusive features:
1. Auto-completion
Dashboard input box supports command and parameter auto-completion:
- Command name completion: Type
wa→ Press Tab →watch - Parameter completion: Type
watch -→ Press Tab → Show all parameters - Pattern completion: Type
watch mymod→ Press Tab → Show classes and methods in module
Completion Sources:
- Dynamically fetch module, class, method information from target process
- Cache completion results to improve response speed
2. Real-time Streaming Data
All observation commands (watch / trace / stack / monitor / top) support real-time streaming updates:
- Data pushed as observation frames (OBS frame)
- TUI automatically parses and updates interface
- Supports pause/resume stream (some views)
3. Interactive Tree Structure
Trace view provides interactive tree structure:
- Nodes can expand/collapse
- Mouse click support
- Keyboard navigation (↑ / ↓ / Enter / ← / →)
4. Color Coding
TUI uses colors to enhance data readability:
- Success/Failure: Green=success, red=failure
- Timing Levels: Green=fast (<10ms), yellow=medium (10-100ms), red=slow (>=100ms)
- CPU Usage: Color intensity indicates CPU usage level
- Log Levels: DEBUG=blue, INFO=green, WARNING=yellow, ERROR=red
5. Dedicated Clients
Each view uses an independent StreamingAgentClient:
- Avoid data confusion
- Supports concurrent operations (multiple views working simultaneously)
- Automatic reconnection mechanism
6. Auto-follow
Watch / Trace / Stack views support auto-scrolling:
- Latest data always visible
- Can manually stop auto-follow (scroll up)
- Manual scroll to bottom restores auto-follow
TUI vs CLI Comparison
| Feature | TUI Mode | CLI Mode |
|---|---|---|
| Interaction | Real-time, visual, keyboard navigation | Command-line input, suitable for scripting |
| Data Display | Tree structure, tables, color coding | Pure JSON output |
| Real-time Updates | Auto-refresh, streaming push | Manual refresh or re-execute commands |
| Auto-completion | Supports command, parameter, pattern completion | Requires shell completion plugin |
| Multi-tasking | Multiple views concurrently, quick switching | Requires multiple terminal windows |
| Use Cases | Interactive diagnostics, real-time monitoring, exploratory debugging | Scripting, automation, CI/CD integration |
| Output Format | Formatted tables, tree structure, color highlighting | JSONL (convenient for jq / grep processing) |
| Learning Curve | Medium (need to learn shortcuts) | Low (standard CLI commands) |
| Performance Overhead | Slightly higher (UI rendering) | Low (pure data transfer) |
Selection Recommendations:
- Development Debugging: Prioritize TUI (better interaction experience)
- Automation Scripts: Use CLI (standardized output format)
- CI/CD Integration: Use CLI (no TTY environment)
- Performance Analysis: Both work (TUI visualization more intuitive, CLI convenient for data export)
Usage Tips
1. Quick View Switching
Use number keys to quickly switch between views without returning to Dashboard:
Press 2 → Watch view
Press 3 → Trace view
Press 5 → Monitor view
Press 0 → Top view
2. Combined Use of Multiple Views
Different views can work concurrently (each view uses an independent client):
- Start observation in Watch view (press
2, enter command, press Enter) - Switch to Monitor view to start monitoring (press
5, enter command, press Enter) - Switch to Top view to start performance profiling (press
0, enter command, press Enter) - Switch between views to view real-time data
3. Use Command History
Dashboard input box supports command history:
↑: Previous command↓: Next command- History persists within session
4. Quick Copy Output
TUI output can be directly copied to clipboard:
- Use mouse to select text
- Ctrl+C to copy (or terminal default shortcut)
- Paste to other tools (e.g., editor, document)
5. Theme Customization
Choose appropriate theme based on terminal background:
# Light background
peeka --theme solarized-light

# Dark background
peeka --theme dracula

# List all themes
peeka --list-themes
Troubleshooting
1. TUI Startup Failure
Error: ModuleNotFoundError: No module named 'textual'
Solution:
pip install peeka[tui]
# or
pip install textual
2. Terminal Display Abnormalities
Error: Characters display incorrectly, colors missing
Solution:
- Ensure terminal supports 256 colors or 24-bit true color
- Set environment variables:
export TERM=xterm-256color
export COLORTERM=truecolor
3. Shortcut Key Conflicts
Issue: Shortcuts intercepted by terminal or shell
Solution:
- Check terminal shortcut settings
- Use
escapekey to return to previous level (replaceq) - Enter complete commands in Dashboard (don’t use shortcuts)
4. Performance Issues
Issue: TUI interface lag, high latency
Solution:
- Reduce sampling frequency (top command uses larger
--interval) - Reduce observation count (watch command uses
-nto limit count) - Use CLI mode (TUI rendering has overhead)
5. Connection Lost
Issue: Connection lost or Socket error
Solution:
- Check if target process is still running
- Check if socket file (
/tmp/peeka_<pid>.sock) exists - Re-attach to target process
Permission Requirements
TUI mode permission requirements are the same as CLI mode:
- Attach Process: Requires
CAP_SYS_PTRACEor same UID - ptrace_scope: Requires
ptrace_scope <= 1(Linux) - Python Version:
- Python 3.14+: Uses PEP 768
sys.remote_exec() - Python 3.8.1-3.13: Linux requires GDB and python3-dbg; macOS requires LLDB (Xcode Command Line Tools)
- Python 3.14+: Uses PEP 768
For detailed permission requirements, see attach command documentation
Summary
Peeka TUI provides a complete interactive diagnostic experience, suitable for scenarios requiring frequent operations, real-time monitoring, and visual analysis. Through 10 dedicated views and global shortcuts, developers can efficiently diagnose Python application issues without memorizing complex command parameters.
Best Practices:
- Development environment: Prioritize TUI (better interaction experience)
- Production environment: Choose TUI (monitoring) or CLI (scripting) based on needs
- Automation scenarios: Use CLI (standardized output, easy integration)
Start using TUI:
peeka
Press ? to view help, press 1/2/3/4/5/6/7/8/9/0 to switch views, and start your diagnostic journey!