Quick Start
Get started with Peeka’s basic features in just a few simple steps.
Table of Contents
- First Example
- Core Features Demo
- Data Processing
- Using TUI Interface
- Real-World Use Cases
- Best Practices
- Next Steps
First Example
1. Prepare Target Program
Create a simple Python program demo.py:
# demo.py
import time

class Calculator:
    def add(self, a, b):
        time.sleep(0.1)  # Simulate computation time
        return a + b

    def multiply(self, a, b):
        time.sleep(0.05)
        return a * b

def main():
    calc = Calculator()
    while True:
        result1 = calc.add(1, 2)
        print(f"add(1, 2) = {result1}")

        result2 = calc.multiply(3, 4)
        print(f"multiply(3, 4) = {result2}")

        time.sleep(1)

if __name__ == "__main__":
    print(f"Process PID: {os.getpid()}")
    main()
2. Run Target Program
python demo.py
# Output: Process PID: 12345
3. Attach to Process
In another terminal window:
peeka-cli attach 12345
Output:
{"type":"status","level":"info","message":"Attaching to process 12345"}
{"type":"success","command":"attach","data":{"pid":12345,"socket":"/tmp/peeka_xxx.sock"}}
4. Observe Function Calls
Observe calls to the add method:
peeka-cli watch "demo.Calculator.add" --times 3
Output:
{"type":"event","event":"watch_started","data":{"watch_id":"watch_001","pattern":"demo.Calculator.add"}}
{"type":"observation","watch_id":"watch_001","timestamp":1705586200.123,"func_name":"demo.Calculator.add","args":[1,2],"result":3,"success":true,"duration_ms":100.123,"count":1}
{"type":"observation","watch_id":"watch_001","timestamp":1705586201.123,"func_name":"demo.Calculator.add","args":[1,2],"result":3,"success":true,"duration_ms":100.087,"count":2}
{"type":"observation","watch_id":"watch_001","timestamp":1705586202.123,"func_name":"demo.Calculator.add","args":[1,2],"result":3,"success":true,"duration_ms":100.091,"count":3}
{"type":"event","event":"watch_stopped","data":{"watch_id":"watch_001","reason":"max_count_reached"}}
Core Features Demo
Watch Function Calls (watch)
Basic Observation
# Observe 5 calls
peeka-cli watch "demo.Calculator.add" --times 5

# Observe indefinitely (stop with Ctrl+C)
peeka-cli watch "demo.Calculator.add"
Conditional Filtering
Observe only calls that meet specific conditions:
# Only observe calls where the first argument is greater than 100
peeka-cli watch "demo.Calculator.multiply" --condition "params[0] > 100"

# Only observe calls with execution time exceeding 10ms
peeka-cli watch "demo.Calculator.add" --condition "cost > 10"

# Combined conditions
peeka-cli watch "demo.func" --condition "len(params) > 2 and cost > 5"
Observation Point Control
# Observe at function entry (view input parameters)
peeka-cli watch "demo.Calculator.add" --before

# Observe only on success
peeka-cli watch "demo.Calculator.add" --success

# Observe only on exception
peeka-cli watch "demo.Calculator.add" --exception
Trace Call Chain (trace)
View the complete call chain and execution time of each call:
peeka-cli trace "demo.Calculator.add" --depth 3 --times 1
Output (tree structure):
`---[125.3ms] demo.Calculator.add()
    +---[2.1ms] time.sleep()
    `---[1.2ms] builtins.print()
Trace Call Stack (stack)
See who calls the function:
peeka-cli stack "demo.Calculator.add" --times 1
Output:
Thread: MainThread
  File "demo.py", line 15, in main
    result1 = calc.add(1, 2)
  File "demo.py", line 6, in add
    return a + b
Performance Monitoring (monitor)
Real-time statistics on function performance metrics:
peeka-cli monitor "demo.Calculator.add" --interval 5 -c 3
Output:
{"type":"observation","timestamp":1705586200.123,"func_name":"demo.Calculator.add","total":10,"success":10,"fail":0,"avg_rt":100.5,"min_rt":98.2,"max_rt":105.3}
Data Processing
Using jq to Process Output
Peeka outputs standard JSONL format, which can be easily integrated with tools like jq.
Extract Observation Data
# Show only observation data (filter other messages)
peeka-cli watch "demo.func" | jq 'select(.type == "observation")'

# Show only function return values
peeka-cli watch "demo.func" | jq 'select(.type == "observation") | .result'

# Show arguments and return values
peeka-cli watch "demo.func" | jq 'select(.type == "observation") | {args, result}'
Filtering and Statistics
# Filter slow calls (execution time > 10ms)
peeka-cli watch "demo.func" | jq 'select(.type == "observation" and .duration_ms > 10)'

# Calculate success rate
peeka-cli watch "demo.func" | \
  jq -r 'select(.type == "observation") | if .success then "OK" else "ERROR" end' | \
  uniq -c

# Calculate average execution time
peeka-cli watch "demo.func" --times 100 | \
  jq 'select(.type == "observation") | .duration_ms' | \
  awk '{sum+=$1; count++} END {print "avg:", sum/count, "ms"}'
Save to File
# Save observation data
peeka-cli watch "demo.func" --times 1000 > observations.jsonl

# Subsequent analysis
cat observations.jsonl | jq 'select(.type == "observation" and .success == false)'
Using TUI Interface
Peeka provides an interactive TUI interface based on Textual.
Launch TUI
peeka
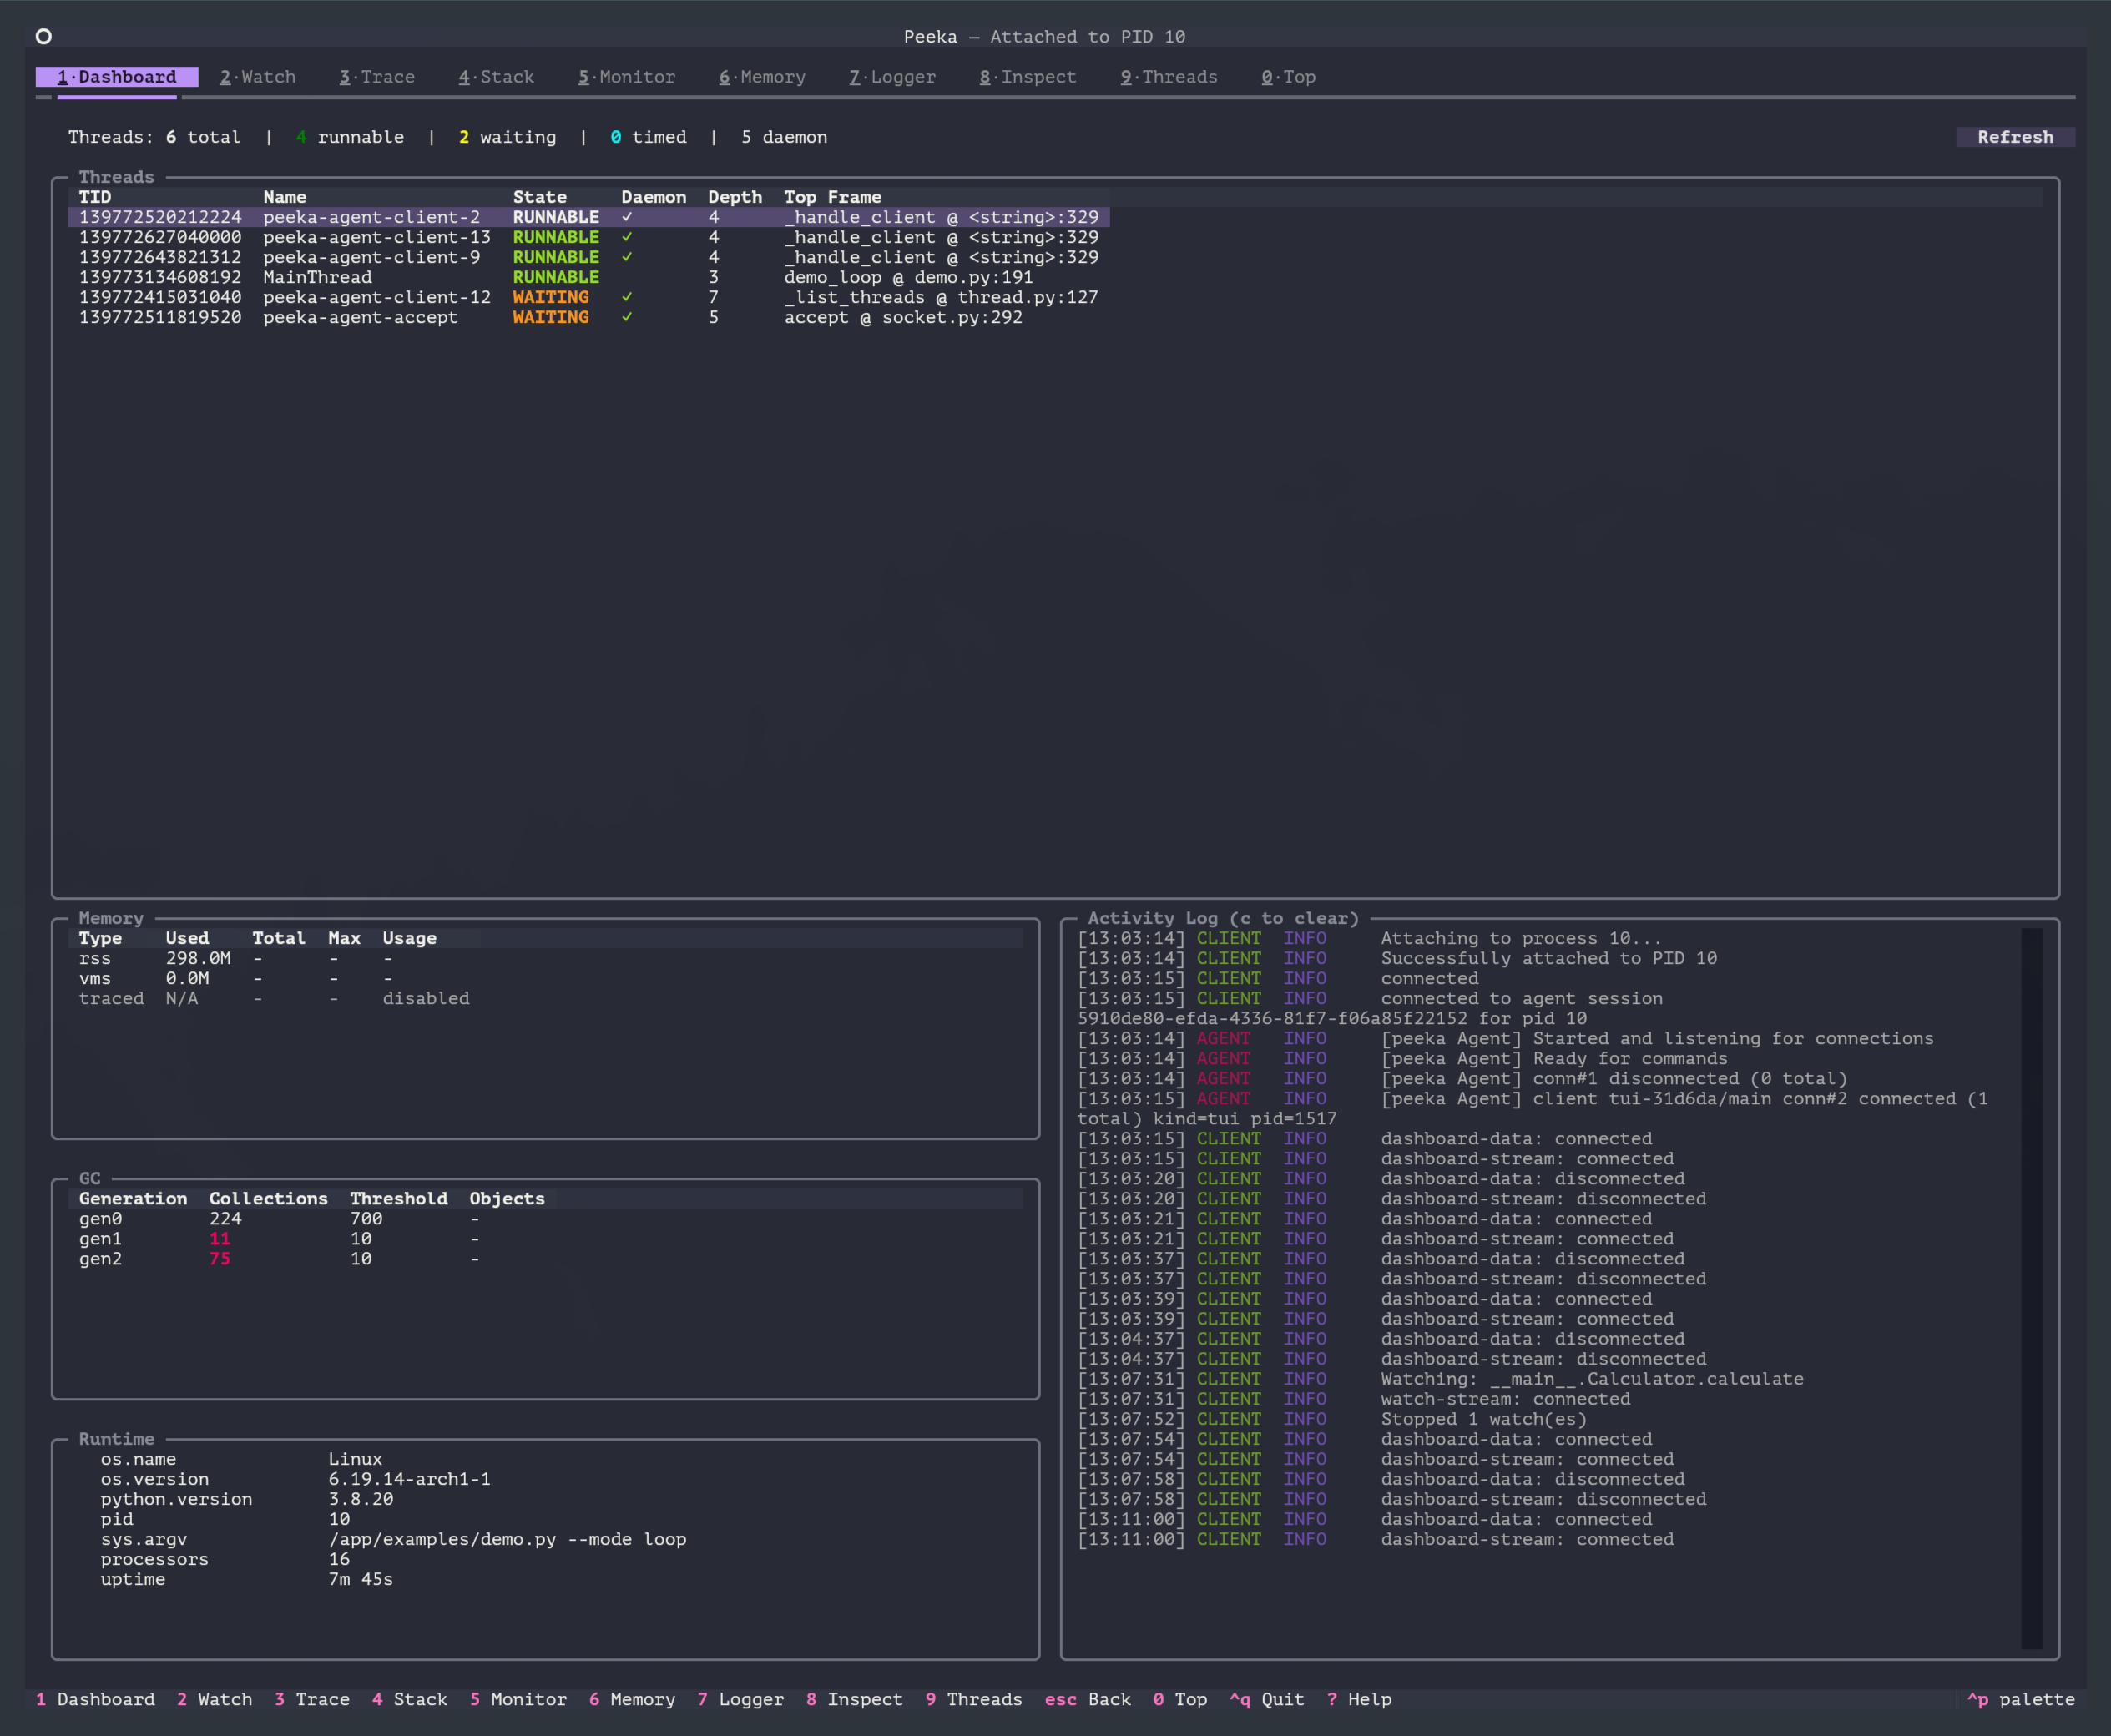
TUI Features
- Process Selection - Automatically discover and select target processes
- Dashboard View (
1) - Real-time display of process information - Watch View (
2) - Interactive function observation - Trace View (
3) - Visualize call tree - Stack View (
4) - Call stack tracing - Monitor View (
5) - Performance monitoring - Memory View (
6) - Memory analysis - Logger View (
7) - Log management - Inspect View (
8) - Runtime object inspection - Threads View (
9) - Thread analysis - Top View (
0) - Function-level performance sampling
TUI Shortcuts
| Shortcut | Function |
|---|---|
1 |
Switch to Dashboard view |
2 |
Switch to Watch view |
3 |
Switch to Trace view |
4 |
Switch to Stack view |
5 |
Switch to Monitor view |
6 |
Switch to Memory view |
7 |
Switch to Logger view |
8 |
Switch to Inspect view |
9 |
Switch to Threads view |
0 |
Switch to Top view |
? |
Show help |
q |
Quit |
For more TUI usage details, please refer to TUI User Guide.
Real-World Use Cases
Scenario 1: Diagnose Slow API
# Observe API handler function, find slow calls
peeka-cli watch "app.api.handle_request" --condition "cost > 1000"

# Trace complete call chain of slow calls
peeka-cli trace "app.api.handle_request" --condition "cost > 1000" --depth 5
Scenario 2: Locate Exception Causes
# Observe only exceptions
peeka-cli watch "app.service.process" --exception

# View call stack when exception occurs
peeka-cli stack "app.service.process" --condition "throwExp != None"
Scenario 3: Monitor Function Performance
# Collect performance metrics every 10 seconds
peeka-cli monitor "app.service.critical_func" --interval 10

# Combine with jq for real-time alerts
peeka-cli monitor "app.service.critical_func" --interval 5 | \
  jq 'select(.type == "observation" and .avg_rt > 100) | "Alert: avg RT = \(.avg_rt)ms"'
Scenario 4: Verify Parameters
# Check calls with specific parameter values
peeka-cli watch "app.service.process" --condition "params[0] == 'debug_value'"

# View parameter distribution
peeka-cli watch "app.service.process" --times 100 | \
  jq 'select(.type == "observation") | .args[0]' | \
  sort | uniq -c
Best Practices
1. Use Conditional Filtering to Reduce Noise
In production, functions are called frequently. Use conditional filtering to observe only critical calls:
# ✅ Recommended: Only observe slow calls
peeka-cli watch "func" --condition "cost > 100"

# ❌ Not recommended: Observe all calls (large data volume)
peeka-cli watch "func"
2. Limit Observation Count
Avoid generating too much data from long-term observation:
# ✅ Recommended: Observe fixed number of times
peeka-cli watch "func" --times 10

# ❌ Not recommended: Infinite observation
peeka-cli watch "func"  # May generate large amounts of data
3. Use JSONL Format for Easy Analysis
Save observation data as JSONL for subsequent analysis:
# Collect data
peeka-cli watch "func" --times 1000 > data.jsonl

# Offline analysis
cat data.jsonl | jq 'select(.type == "observation") | {duration_ms, success}' | \
  jq -s 'group_by(.success) | map({success: .[0].success, count: length})'
4. Layered Diagnosis
From coarse to fine, gradually locate problems:
# 1. First use monitor to understand overall performance
peeka-cli monitor "app.api.*" --interval 10

# 2. After discovering anomalies, use watch to observe details
peeka-cli watch "app.api.slow_func" --condition "cost > 100"

# 3. Use trace to track complete call chain
peeka-cli trace "app.api.slow_func" --depth 5
Next Steps
- Command Reference - Learn detailed usage of all commands
- Examples - More real-world scenarios
- Architecture - Understand Peeka’s design principles
- Troubleshooting - Solutions when encountering problems