watch Command
Table of Contents
- Overview
- TUI Usage
- Use Cases
- Command Format
- Basic Usage
- Observation Timing Control
- Condition Filtering
- Output Format
- Data Processing and Analysis
- Performance Impact
- FAQ
- Advanced Techniques
- References
- Version History
Overview
The watch command is used to observe the execution of specified Python functions, capturing input parameters, return values, exception information, execution duration, and other data. This is Peeka’s core diagnostic command, suitable for real-time troubleshooting and performance analysis in production environments.
Coroutine support (v0.1.13+): Peeka auto-detects coroutine functions (async def) and async generators at inject time, preserves AtEnter/AtExit/AtExceptionExit semantics with async wrapper.
Notice ⚠️ --times behavior change (v0.1.13+): This parameter now counts observations client-side (after receiving them) rather than agent-side (before sending them). If the agent sends more observations than the --times limit, the client will stop receiving and discard remaining data. If your scripts rely on precise observation count control, see troubleshooting.
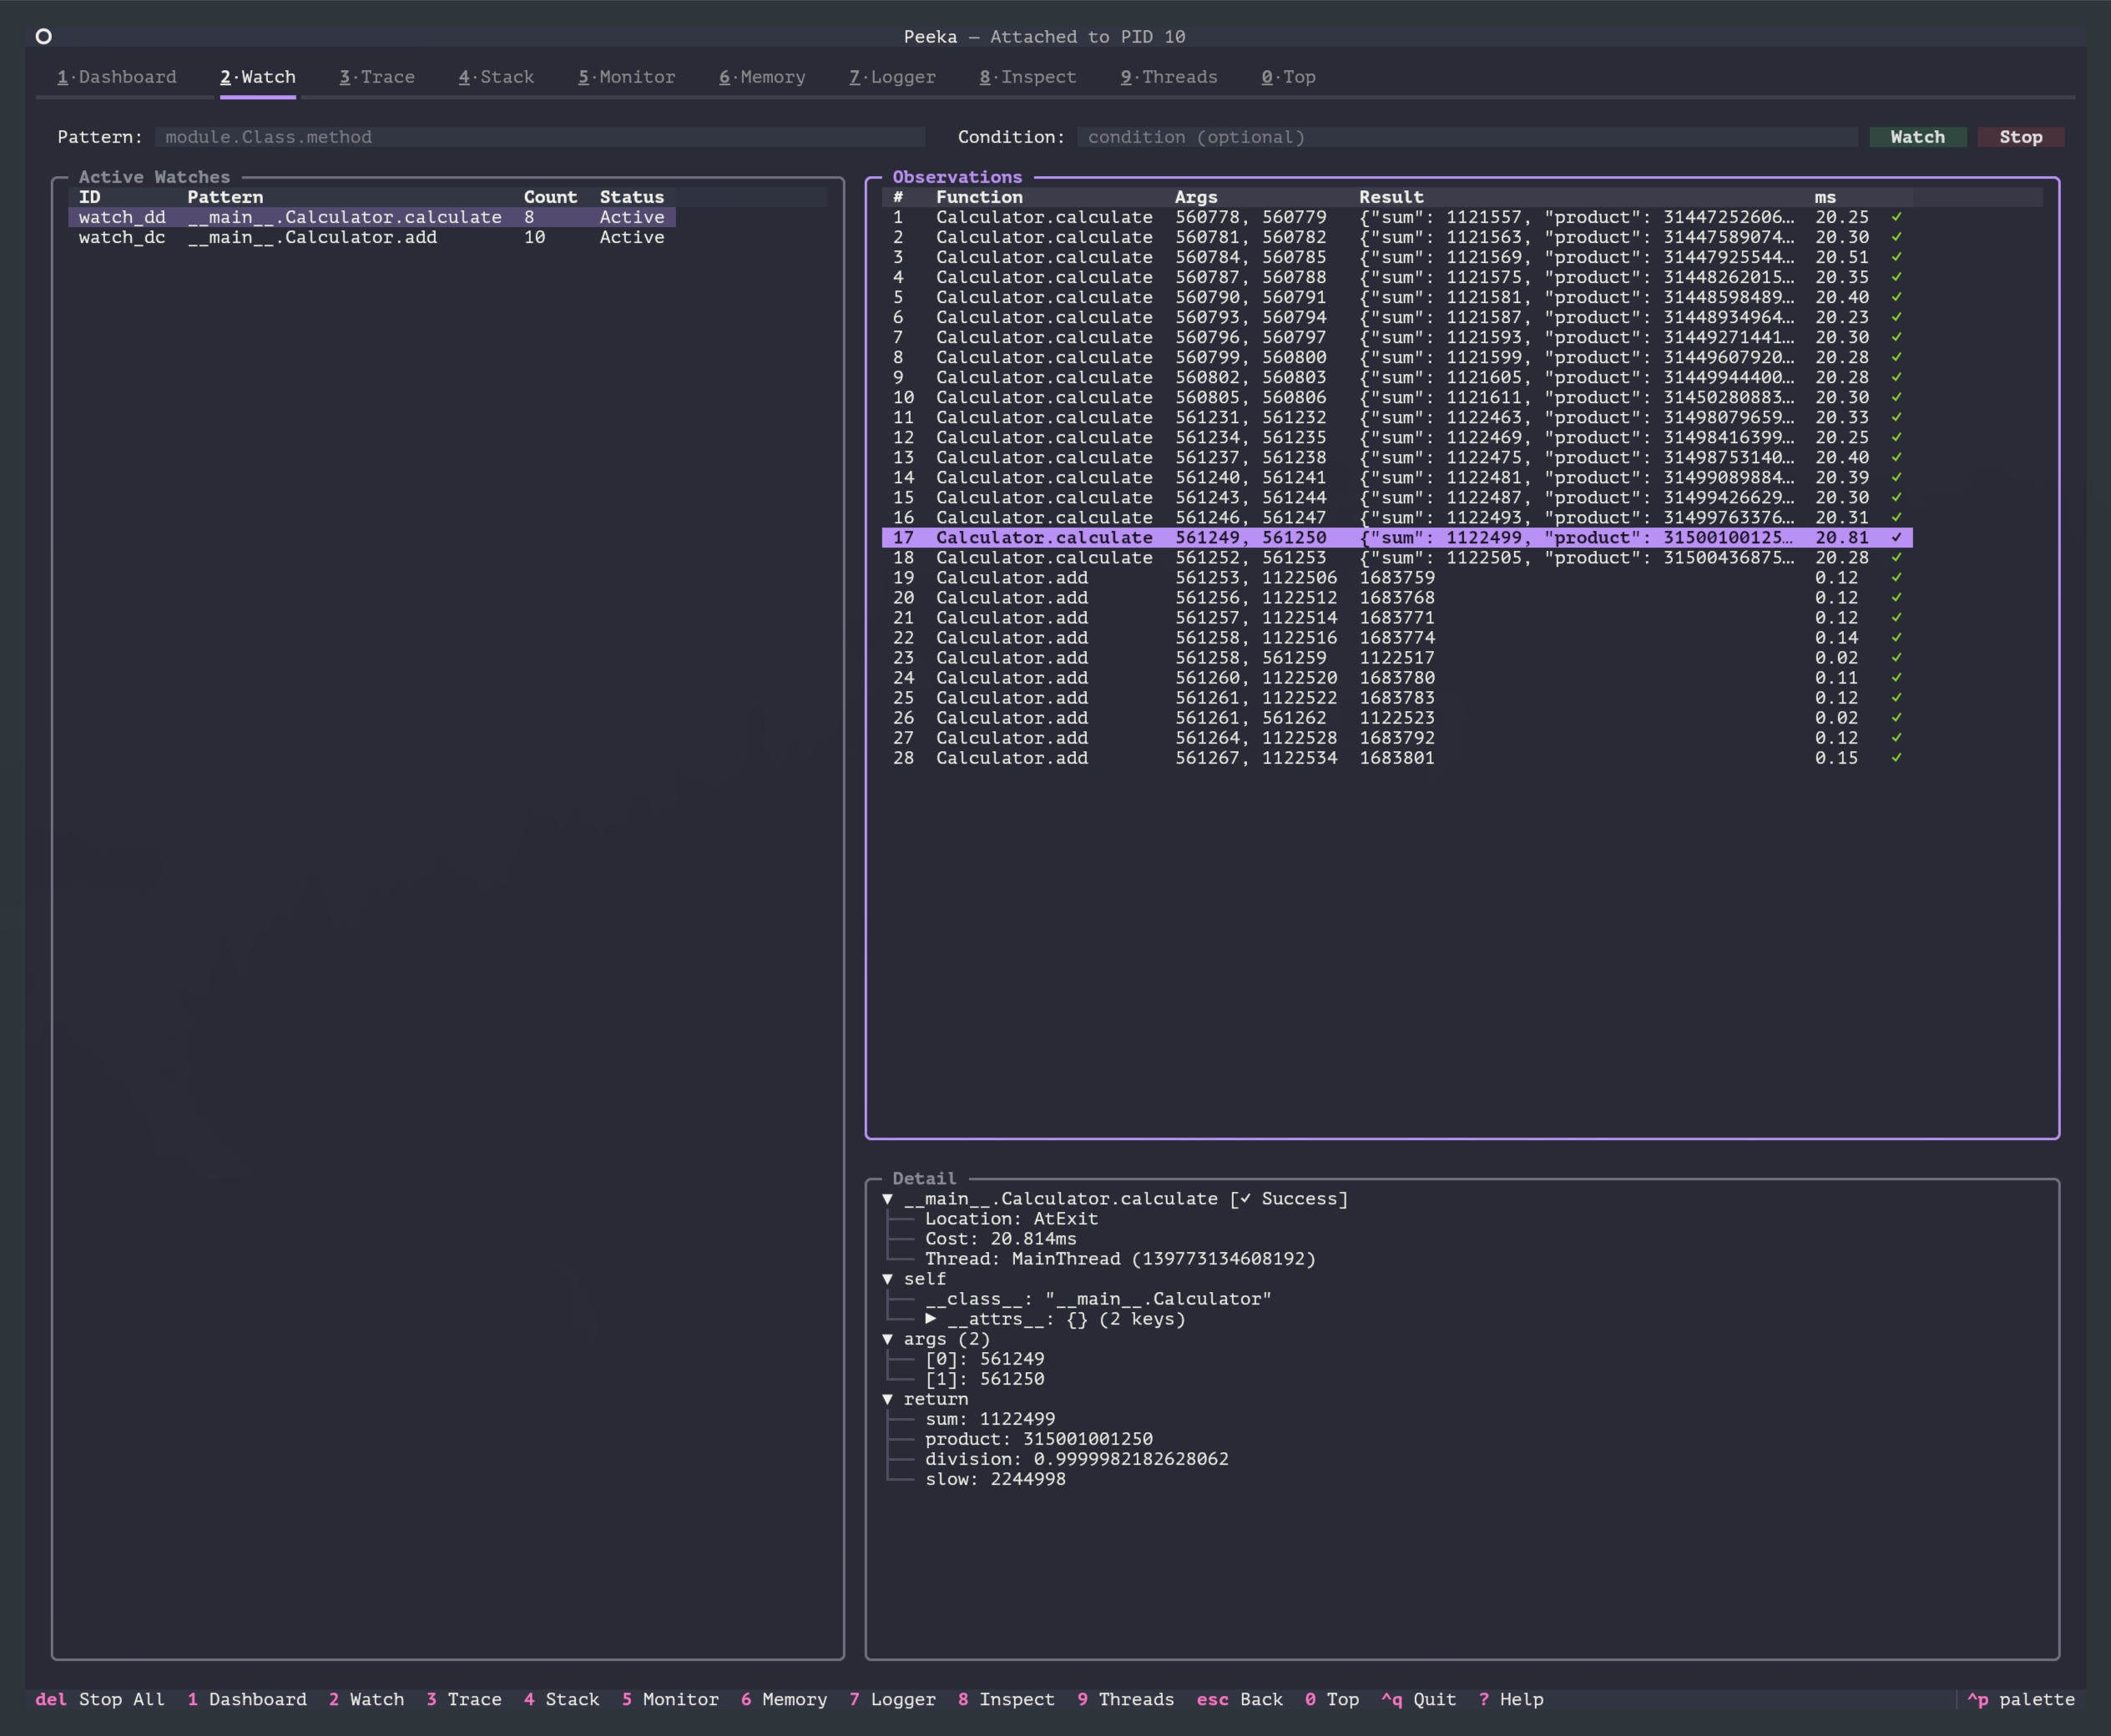
TUI Usage
In TUI mode, press 2 key to switch to Watch View, providing the following interactive features:
- Pattern Input: Supports function name auto-completion (fetched in real-time from the target process)
- Parameter Configuration: Visual configuration of depth, times, observation points, condition expressions
- Real-time Streaming Observation: Observation data displayed as streaming table, auto-updates
- Quick Operations:
- Press Enter after entering pattern to start observation
- Press
sto stop current observation - Press
cto clear observation records - Press
rto refresh view
CLI Equivalent Commands: All examples below use CLI commands for demonstration. TUI provides the same functionality with a graphical interface.
Use Cases
- Troubleshooting: Observe if functions are called, if parameters are correct, if return values meet expectations
- Performance Analysis: Track function execution duration, identify slow calls
- Conditional Diagnostics: Only observe calls that meet specific conditions (e.g., parameters greater than a certain value)
- Exception Analysis: Capture exception information and stack traces thrown by functions
- Real-time Monitoring: Stream observation data output, supports JSON format for easy integration with monitoring systems
Command Format
peeka-cli attach <pid>    # First attach to target process
peeka-cli watch <pattern> [options]
Parameters
| Parameter | Description | Default | Example |
|---|---|---|---|
pattern |
Function matching pattern | - | module.Class.method |
-x, --depth |
Output object depth | 2 |
-x 3 |
-n, --times |
Number of observations (-1 for infinite) | -1 |
-n 10 |
--condition |
Condition expression (supports cost variable) |
None | --condition "params[0] > 100" |
--client |
Existing client session ID; auto-creates an ephemeral client when omitted | Auto | --client client_123 |
-b, --before |
Observe before function call (AtEnter) | false |
-b |
-e, --exception |
Only observe when exception thrown (AtExceptionExit) | false |
-e |
-s, --success |
Only observe on successful return (AtExit) | false |
-s |
-f, --finish |
Observe after function ends (success or exception) | true |
-f |
Note:
- If no
-b/-e/-s/-fflags are specified, defaults to-f(observe all completion cases) --conditionparameter is still supported (for backward compatibility), but--conditionis recommended
Function Matching Pattern (pattern)
Supports the following formats:
# 1. Module-level function
"mymodule.my_function"

# 2. Class method
"mymodule.MyClass.my_method"

# 3. Nested class method
"mypackage.mymodule.OuterClass.InnerClass.method"

# 4. Module path
"package.subpackage.module.function"
Note: Must use complete module path (from import root), wildcards not supported.
Basic Usage
1. Observe Function Calls
# First attach to target process
peeka-cli attach 12345

# Observe 5 calls
peeka-cli watch "calculator.Calculator.add" -n 5
Output Example:
{
  "watch_id": "watch_a1b2c3d4",
  "timestamp": 1705586200.123,
  "location": "AtExit",
  "func_name": "calculator.Calculator.add",
  "params": [
    10,
    20
  ],
  "kwargs": {},
  "target": {
    "__attrs__": {
      "name": "calc1"
    }
  },
  "returnObj": 30,
  "success": true,
  "throwExp": null,
  "cost": 0.045,
  "thread_id": 140234567890,
  "thread_name": "MainThread"
}
Field Descriptions:
| Field | Description | Example Value |
|---|---|---|
watch_id |
Observation ID | "watch_a1b2c3d4" |
timestamp |
Timestamp | 1705586200.123 |
location |
Observation location | "AtEnter" / "AtExit" / "AtExceptionExit" |
func_name |
Function name | "module.Class.method" |
params |
Positional arguments | [10, 20] |
kwargs |
Keyword arguments | {"debug": true} |
target |
Target object (self, instance methods only) | {"__attrs__": {...}} |
returnObj |
Return value | 30 |
success |
Success status | true / false |
throwExp |
Exception info | "ValueError: ..." |
cost |
Execution duration (ms) | 0.045 |
thread_id |
Thread ID | 140234567890 |
thread_name |
Thread name | "MainThread" |
Async Execution Profile (v0.1.14)
When observing coroutine functions or async generators, v0.1.14 emits an extra execution_profile JSON line that separates wall time, CPU time, context switches, coroutine termination, and async generator yield count. On Windows, cpu_cost and context_switches may be null.
{
  "type": "execution_profile",
  "func_name": "service.fetch_user",
  "mode": "coroutine",
  "scheduler": "asyncio",
  "yields": null,
  "wall_cost": 0.023,
  "cpu_cost": 0.002,
  "context_switches": 4,
  "marker": "executor",
  "termination": "returned"
}
| Field | Description |
|---|---|
mode |
coroutine or async_generator |
wall_cost |
Wall-clock duration in seconds |
cpu_cost |
Process CPU time in seconds, or null when unavailable |
context_switches |
Context switch count during observation, or null when unavailable |
marker |
Coroutine wait marker, such as executor; omitted for async generators |
termination |
returned, cancelled, errored, exhausted, or closed |
yields |
Async generator yield count; null for coroutines |
2. Adjust Output Depth
# Depth 1: Only show object types
peeka-cli watch "service.UserService.get_user" -x 1

# Depth 3: Show 3 levels of nested structure
peeka-cli watch "service.UserService.get_user" -x 3
Depth Comparison:
# Original object
user = {
    "id": 1,
    "name": "Alice",
    "profile": {
        "age": 25,
        "address": {
            "city": "Beijing"
        }
    }
}

# depth=1
{"id": 1, "name": "Alice", "profile": "{'age': 25, 'address': {...}}"}

# depth=2
{"id": 1, "name": "Alice", "profile": {"age": 25, "address": "{'city': 'Beijing'}"}}

# depth=3
{"id": 1, "name": "Alice", "profile": {"age": 25, "address": {"city": "Beijing"}}}
3. Infinite Observation (Streaming Output)
# Continuous observation until manually stopped (Ctrl+C)
peeka-cli watch "api.handler.process_request"
Suitable for:
- Real-time monitoring of production environment
- Waiting to reproduce intermittent issues
- Long-term data collection and analysis
4. Observe Static Methods and Class Methods
# Static method
peeka-cli watch "utils.Helper.static_method"

# Class method
peeka-cli watch "models.User.from_dict"
Observation Timing Control
Peeka supports observation timing control, allowing observation at different stages of function execution.
Observation Timing Flags
| Flag | Description | Observation Timing | location Field | Available Data |
|---|---|---|---|---|
-b, --before |
Before call | On entry | AtEnter |
params, kwargs, target |
-s, --success |
On success | After normal return | AtExit |
Above + returnObj, cost |
-e, --exception |
On exception | After exception | AtExceptionExit |
Above + throwExp, cost |
-f, --finish |
On completion | Success or exception | AtExit / AtExceptionExit |
All fields |
Default Behavior: If no flags specified, defaults to -f (observe all completion cases)
Usage Examples
1. Observe Function Entry State (-b)
# Observe parameters when function is called
peeka-cli watch "service.UserService.update_user" -b
Output:
{
  "location": "AtEnter",
  "params": [{"id": 1, "name": "Alice"}],
  "kwargs": {"force": true},
  "target": {"__attrs__": {"db": "..."}},
  "returnObj": null,
  "cost": 0.0
}
Use Cases:
- Confirm if function is called
- Check if input parameters are correct
- Debug function entry logic
2. Only Observe Successful Returns (-s)
# Only observe successful calls, ignore exceptions
peeka-cli watch "api.handler.process" -s
Output (success only):
{
  "location": "AtExit",
  "params": [{"user_id": 123}],
  "returnObj": {"status": "ok"},
  "success": true,
  "cost": 45.2
}
Use Cases:
- Analyze return values of successful calls
- Track performance of successful calls
- Ignore exception cases
3. Only Observe Exception Cases (-e)
# Only observe calls that throw exceptions
peeka-cli watch "database.query" -e
Output (exception only):
{
  "location": "AtExceptionExit",
  "params": ["SELECT * FROM users"],
  "throwExp": "DatabaseError: Connection timeout",
  "success": false,
  "cost": 5000.0
}
Use Cases:
- Focus on error situations
- Analyze conditions under which exceptions occur
- Monitor error rate
4. Observe Complete Execution Process (-b -s)
# Observe both entry and successful return
peeka-cli watch "calculator.calculate" -b -s
Output (2 records per call):
// Record 1: Entry
{
  "location": "AtEnter",
  "params": [
    10,
    20
  ],
  "returnObj": null
}

// Record 2: Exit
{
  "location": "AtExit",
  "params": [
    10,
    20
  ],
  "returnObj": 30,
  "cost": 0.123
}
Use Cases:
- Observe if parameters are modified during function execution
- Completely trace function execution flow
- Analyze function side effects
5. Observe All Cases (-b -e -s)
# Observe entry, success, and exception cases
peeka-cli watch "service.critical_operation" -b -e -s
Output (2 or 3 records depending on execution result):
- Always produces 1
AtEnterrecord - Success produces 1
AtExitrecord - Exception produces 1
AtExceptionExitrecord
Use Cases:
- Complete diagnosis of complex functions
- Development environment debugging
- Production environment deep analysis
Condition Filtering
Condition Expression Syntax
Peeka uses the simpleeval library to implement safe condition expression evaluation, supporting the following syntax:
Supported Operations
| Type | Operators/Functions | Example |
|---|---|---|
| Comparison | >, <, >=, <=, ==, != |
params[0] > 100 |
| Logical | and, or, not |
params[0] > 10 and params[1] < 100 |
| Arithmetic | +, -, *, /, %, ** |
params[0] + params[1] > 100 |
| Membership | in, not in |
'error' in str(result) |
| Functions | len(), str(), int(), float(), bool() |
len(params) > 2 |
| String | .startswith(), .endswith(), .upper(), .lower() |
str(params[0]).startswith('test_') |
| Access | [], .get() |
kwargs.get('debug') == True |
Available Variables
| Variable | Description | Type | Available Timing |
|---|---|---|---|
params |
Positional arguments | tuple | All timing |
kwargs |
Keyword arguments | dict | All timing |
target |
Target object (self) | object | All timing (instance methods only) |
cost |
Execution duration (ms) | float | Only available with -s/-e/-f |
Note:
costvariable only available after function completion (-s/-e/-f), not available with-btargetonly available when observing instance methods,Nonefor module-level functions or static methods
Security Guarantees:
- ❌ Forbids
__import__,eval,exec,compile,open - ❌ Forbids accessing
__class__,__subclasses__and other reflection attributes - ❌ Forbids executing arbitrary code
Condition Filtering Examples
1. Parameter Filtering
# Only observe calls where first parameter > 100
peeka-cli watch "calculator.multiply" --condition "params[0] > 100"

# Parameter count filtering
peeka-cli watch "api.handler" --condition "len(params) > 3"

# Multiple conditions combined
peeka-cli watch "service.query" --condition "params[0] > 10 and params[1] < 100"
2. Keyword Argument Filtering
# Only observe calls with debug parameter
peeka-cli watch "logger.log" --condition "kwargs.get('debug') == True"

# Check if parameter exists
peeka-cli watch "api.request" --condition "'user_id' in kwargs"
3. String Matching
# Parameter starts with specific prefix
peeka-cli watch "db.query" --condition "str(params[0]).startswith('SELECT')"

# Parameter contains specific substring
peeka-cli watch "handler.process" --condition "'error' in str(params[0])"
4. Type Checking
# Parameter type filtering
peeka-cli watch "converter.convert" --condition "isinstance(params[0], dict)"
5. Complex Conditions
# Combine multiple conditions
peeka-cli watch "service.process" \
  --condition "len(params) > 2 and params[0] > 100 and 'debug' in kwargs"

# String operations
peeka-cli watch "parser.parse" \
  --condition "len(str(params[0])) > 50 and str(params[0]).endswith('.json')"
6. Performance Filtering (cost variable)
# Only observe calls exceeding 100ms execution time (similar to #cost)
peeka-cli watch "database.query" --condition "cost > 100"

# Combine performance and parameter conditions
peeka-cli watch "api.handler" --condition "cost > 50 and len(params) > 0"

# Observe return values of slow calls
peeka-cli watch "service.process" -s --condition "cost > 200"
Note:
costvariable only available with-s/-e/-f(after function completion)- Using
costwith-bwill cause condition to always return True (cost=0)
7. Object State Filtering (target variable)
# Only observe calls with specific object state (instance methods only)
# Note: Current version has target available but doesn't support property navigation (target.attr)
# Can check if target exists in condition
peeka-cli watch "service.UserService.update" --condition "params[0] > 0"
Limitations:
- Current version has
targetvariable available, but simpleeval doesn’t support property navigation (liketarget.field_name) - Future versions may expand to support object property access
Debugging Condition Expressions
If condition expression doesn’t work, check:
- Syntax error: Check if expression conforms to Python syntax
- Variable spelling: Confirm using
paramsandkwargs(notargs) - Index out of bounds: Ensure
params[i]doesn’t exceed bounds - Type error: Note the actual parameter types
- Print debug: Observe once without condition, check actual params and kwargs content
Example: View actual parameter content
# First observe without condition once
peeka-cli watch "mymodule.func" -n 1

# Output:
# {"args": [100, "test"], "kwargs": {"debug": true}, ...}

# Then write condition based on actual output
peeka-cli watch "mymodule.func" --condition "params[0] > 50"
Output Format
JSON Field Descriptions
Each function call outputs one JSON record:
{
  "watch_id": "watch_a1b2c3d4",
  "timestamp": 1705586200.123,
  "location": "AtExit",
  "func_name": "module.Class.method",
  "params": [1, 2],
  "kwargs": {"key": "value"},
  "target": {"__attrs__": {"field": "value"}},
  "returnObj": 42,
  "success": true,
  "throwExp": null,
  "cost": 1.234,
  "thread_id": 140234567890,
  "thread_name": "MainThread"
}
Field Descriptions:
| Field | Type | Description |
|---|---|---|
watch_id |
string | Observation session ID |
timestamp |
float | Call timestamp (Unix time) |
location |
string | Observation location (AtEnter/AtExit/AtExceptionExit) |
func_name |
string | Full function name |
params |
array | Positional argument list |
kwargs |
object | Keyword argument dict |
target |
object | Target object (self, instance methods only) |
returnObj |
any | Return value (on success) |
success |
boolean | Execution success status |
throwExp |
string | Exception info (on failure) |
cost |
float | Execution duration (milliseconds) |
thread_id |
int | Thread ID |
thread_name |
string | Thread name |
Exception Capture
When function throws exception:
{
  "watch_id": "watch_a1b2c3d4",
  "timestamp": 1705586200.123,
  "location": "AtExceptionExit",
  "func_name": "calculator.Calculator.divide",
  "params": [
    10,
    0
  ],
  "kwargs": {},
  "returnObj": null,
  "success": false,
  "throwExp": "ZeroDivisionError: division by zero",
  "cost": 0.032,
  "thread_id": 140234567890,
  "thread_name": "MainThread"
}
Note: Peeka captures exception info but does not suppress exceptions, exceptions are still thrown normally.
Data Processing and Analysis
Using jq to Process JSON
# 1. Extract return value
peeka-cli watch "calculator.add" | jq '.returnObj'

# 2. Extract duration
peeka-cli watch "api.handler" | jq '.cost'

# 3. Filter slow calls (duration > 100ms)
peeka-cli watch "db.query" | jq 'select(.cost > 100)'

# 4. Only show failed calls
peeka-cli watch "service.process" | jq 'select(.success == false)'

# 5. Format output
peeka-cli watch "func" | jq '{time: .timestamp, cost: .cost, result: .returnObj}'
Statistical Analysis
# Count number of calls
peeka-cli watch "func" -n 100 | wc -l

# Calculate average duration
peeka-cli watch "func" -n 100 | jq '.duration_ms' | \
  awk '{sum+=$1; count++} END {print "avg:", sum/count, "ms"}'

# Calculate success rate
peeka-cli watch "func" -n 100 | jq '.success' | \
  awk '{total++; if($1=="true") success++} END {print "success rate:", success/total*100, "%"}'

# Find slowest call
peeka-cli watch "func" -n 100 | jq -s 'max_by(.duration_ms)'
Save to File
# Save as JSONL format (one JSON per line)
peeka-cli watch "func" > observations.jsonl

# Subsequent analysis
cat observations.jsonl | jq 'select(.duration_ms > 10)'
Real-time Monitoring
# Real-time error rate monitoring
peeka-cli watch "api.handler" | \
  jq -r 'if .success then "✓" else "✗ " + .error end'

# Real-time duration monitoring
peeka-cli watch "db.query" | \
  jq -r '"\(.timestamp | strftime("%H:%M:%S")) - \(.duration_ms)ms"'
Performance Impact
Performance Overhead
| Scenario | Overhead | Description |
|---|---|---|
| Unconditional observation | < 2% | Basic parameter capture and serialization |
| Condition filtering | < 3% | Added condition expression evaluation overhead |
| Deep traversal (depth=3) | < 5% | Deep traversal of nested objects |
| High frequency calls (>1000 QPS) | 5-10% | High frequency serialization and network transmission |
Performance Optimization Recommendations
- Use condition filtering: Avoid capturing all calls
# Only capture slow calls (actually captured then filtered, recommend other methods) # Better approach is to combine with parameter filtering peeka-cli watch "func" --condition "params[0] > 1000" -n 100 - Limit observation count: Use
-nparameterpeeka-cli watch "func" -n 50 # Only observe 50 times - Reduce output depth: For complex objects
peeka-cli watch "func" -x 1 # Only show one level -
Avoid high-frequency functions: Don’t observe functions called thousands of times per second (like basic utility functions)
- Stop observation promptly: Stop immediately after troubleshooting
# Ctrl+C to stop observation
Memory Impact
- Buffer size: Default 10000 observation records (approximately 10-50MB)
- Auto-eviction: Automatically discards old data when limit exceeded
FAQ
1. No Observation Data
Possible Reasons:
- Function not called
- Function name misspelled
- Condition expression too strict
- Observation count limit reached (-n parameter)
Troubleshooting Steps:
# 1. Confirm function name is correct (use Python interactive check)
python3 -c "import mymodule; print(mymodule.MyClass.my_method)"

# 2. Remove condition expression, observe once first
peeka-cli watch "mymodule.func" -n 1

# 3. Check if process exists
ps aux | grep 12345
2. Condition Expression Error
Common Errors:
# ❌ Wrong: Using forbidden operations
--condition "__import__('os').system('ls')"  # Security blocked

# ❌ Wrong: Index out of bounds
--condition "params[5] > 10"  # Function only has 3 parameters

# ❌ Wrong: Wrong variable name
--condition "args[0] > 10"  # Should use params not args

# ✓ Correct
--condition "len(params) > 2 and params[0] > 10"
Debug Method:
- First observe once without condition, view actual parameters
- Use simple condition to test (like
len(params) > 0) - Gradually increase condition complexity
3. Output Depth Insufficient
# Problem: Object shows as "{'key': {...}}"
peeka-cli watch "func" -x 2

# Solution: Increase depth
peeka-cli watch "func" -x 3
Note: Maximum depth is 4 to prevent performance issues from deep traversal.
4. Will Observation Affect Business?
Safety Guarantees:
- ✓ Exceptions not suppressed (thrown normally)
- ✓ Observation failure doesn’t affect original function execution
- ✓ Automatic resource cleanup (memory, connections)
- ✓ Low performance overhead (< 5%)
Best Practices:
- First use during low traffic periods
- Start observing low-frequency functions
- Use condition filtering to reduce data volume
- Stop observation promptly after troubleshooting
5. How to Stop Observation?
# Method 1: Ctrl+C to stop current observation

# Method 2: Use reset command to remove the watch enhancement
peeka-cli reset "pattern"

# Method 3: Stop all observations (in interactive mode)
# Current CLI doesn't directly support, need to stop current session via Ctrl+C
Advanced Techniques
1. Multi-Process Observation
# Parallel observation of multiple processes
for pid in 12345 12346 12347; do
  peeka-cli attach $pid
  peeka-cli watch "api.handler" > "logs/watch_$pid.jsonl" 2>&1 &
done
2. Scheduled Observation
# Observe 100 times every hour
while true; do
  peeka-cli watch "scheduler.task" -n 100 >> hourly_samples.jsonl
  sleep 3600
done
3. Alert Integration
# Monitor error rate, alert when threshold exceeded
peeka-cli watch "api.handler" | \
  jq -r 'select(.success == false) | .error' | \
  while read error; do
    echo "Alert: $error" | mail -s "API Error" admin@example.com
  done
4. Prometheus Integration
# Convert observation data to Prometheus metrics
import json
from prometheus_client import Counter, Histogram

call_counter = Counter('function_calls_total', 'Total calls', ['function', 'status'])
duration_histogram = Histogram('function_duration_seconds', 'Duration', ['function'])

for line in sys.stdin:
    data = json.loads(line)
    func = data['func_name']
    status = 'success' if data['success'] else 'error'

    call_counter.labels(function=func, status=status).inc()
    duration_histogram.labels(function=func).observe(data['duration_ms'] / 1000)
References
Version History
| Version | Date | Updates |
|---|---|---|
| 0.1.17 | 2026-06-13 | watch_started event now carries runtime_meta (gevent state, backend, downgrade flag), enabling CLI output and the TUI Watch banner to display runtime info; --times help text updated to “Print N observations then stop” |
| 0.1.16 | 2026-06-07 | Support --client to reuse an existing client session; auto-create an ephemeral client when omitted |
| 0.1.14 | 2026-05-24 | Emit execution_profile for coroutines and async generators with wall/CPU time, context switches, and termination state |
| 0.1.13 | 2026-05-16 | Added coroutine function and async generator support (commit 9e67e01); --times moved to client-side observation counting |
| 0.1.12 | 2026-05-08 | Internal stability improvements |
| 0.1.11 | 2026-05-07 | Fixed async-generator detection and execution profiling |
| 0.1.10 | 2026-05-04 | Fixed coroutine execution profiling with shield/executor markers |
| 0.1.9 | 2026-05-04 | Enhanced socket handling and connection validation |
| 0.1.0 | 2026-03-12 | Initial version with basic watch functionality |