trace Command
Table of Contents
- Overview
- TUI Usage
- Use Cases
- Command Format
- Basic Usage
- Implementation Technology
- Performance Impact
- Usage Examples
- Data Processing and Analysis
- Common Issues
- Advanced Tips
- References
- Changelog
- Version History
Overview
The trace command is used to track the complete call chain and execution time of Python functions, displaying method call hierarchies in a tree structure. This is a powerful performance analysis and diagnostic tool that helps developers quickly identify performance bottlenecks and understand code execution paths.
Peeka’s trace command provides powerful performance analysis and diagnostic capabilities for Python applications.
TUI Usage
In TUI mode, press 3 key to switch to Trace View, providing the following interactive features:
- Pattern Input: Supports function name auto-completion (fetched in real-time from the target process)
- Parameter Configuration: Visual configuration of depth, times, condition expressions, skip-builtin
- Call Tree Visualization: Display call chains as interactive tree structure, expandable/collapsible
- Color-coded Timing:
- 🟢 Green: < 10ms (fast)
- 🟡 Yellow: 10-100ms (medium)
- 🔴 Red: >= 100ms (slow)
- Quick Operations:
- Press Enter after entering pattern to start tracing
- Press Enter to expand/collapse nodes
- Press
cto clear trace records - Press Delete to remove selected record
CLI Equivalent Commands: All examples below use CLI commands for demonstration. TUI provides the same functionality with a graphical interface.
Use Cases
- Performance bottleneck identification: Quickly find slow calls through timing data
- Call chain analysis: Understand function internal call relationships and execution flows
- Code execution path tracking: Observe code execution paths under different conditions
- Sub-function timing analysis: Analyze timing distribution across sub-functions
- Recursive call diagnosis: Track recursive call depth and timing distribution
Command Format
peeka-cli attach <pid>    # First attach to target process
peeka-cli trace <pattern> [options]
Parameters
| Parameter | Description | Default | Example |
|---|---|---|---|
pattern |
Function matching pattern | - | module.Class.method |
-d, --depth |
Trace depth (max call levels) | 3 |
-d 5 |
-n, --times |
Observation count (-1 for unlimited) | -1 |
-n 10 |
--condition |
Condition expression (supports cost variable) |
None | --condition "cost > 50" |
--client |
Existing client session ID; auto-creates an ephemeral client when omitted | Auto | --client client_123 |
--skip-builtin |
Skip built-in and stdlib functions | true |
--skip-builtin=false |
--min-duration |
Minimum duration filter (milliseconds) | 0 |
--min-duration 10 |
Notes:
- Trace depth should not exceed 5 levels; excessive depth significantly increases performance overhead
--skip-builtinis enabled by default to reduce output noise- The
costvariable in condition expressions represents total call duration (milliseconds)
Function Matching Pattern (pattern)
Supports the following formats:
# 1. Module-level function
"mymodule.my_function"

# 2. Class method
"mymodule.MyClass.my_method"

# 3. Nested class method
"mypackage.mymodule.OuterClass.InnerClass.method"

# 4. Module path
"package.subpackage.module.function"
Note: Must use complete module path (from import root). Current version does not support wildcard matching.
Basic Usage
1. Trace Function Call Chain
# First attach to target process
peeka-cli attach 12345

# Trace 5 calls
peeka-cli trace "calculator.Calculator.calculate" -n 5
Output Example:
{
  "type": "observation",
  "watch_id": "trace_abc123",
  "timestamp": 1705586200.123,
  "func_name": "calculator.Calculator.calculate",
  "location": "AtExit",
  "call_tree": [
    {
      "depth": 0,
      "function": "calculator.Calculator.calculate",
      "filename": "/app/calculator.py",
      "lineno": 42,
      "duration_ms": 125.3,
      "children": [
        {
          "depth": 1,
          "function": "calculator.Calculator._validate",
          "filename": "/app/calculator.py",
          "lineno": 18,
          "duration_ms": 2.1
        },
        {
          "depth": 1,
          "function": "calculator.Calculator._compute",
          "filename": "/app/calculator.py",
          "lineno": 25,
          "duration_ms": 98.2,
          "children": [
            {
              "depth": 2,
              "function": "math.sqrt",
              "duration_ms": 95.1
            }
          ]
        },
        {
          "depth": 1,
          "function": "calculator.Logger.info",
          "filename": "/app/logger.py",
          "lineno": 10,
          "duration_ms": 15.7
        }
      ]
    }
  ],
  "total_duration_ms": 125.3,
  "node_count": 5
}
Field Descriptions:
| Field | Description | Example |
|---|---|---|
watch_id |
Observation ID | "trace_abc123" |
timestamp |
Timestamp | 1705586200.123 |
func_name |
Target function name | "calculator.calculate" |
location |
Observation location | "AtExit" |
call_tree |
Call tree (nested structure) | [...] |
total_duration_ms |
Total execution time (milliseconds) | 125.3 |
node_count |
Total call node count | 5 |
Call Tree Node Fields:
| Field | Description | Example |
|---|---|---|
depth |
Call depth (starting from 0) | 0, 1, 2 |
function |
Full function name | "module.Class.method" |
filename |
File path | "/app/module.py" |
lineno |
Line number | 42 |
duration_ms |
Execution time (milliseconds) | 10.5 |
children |
Sub-call list | [...] |
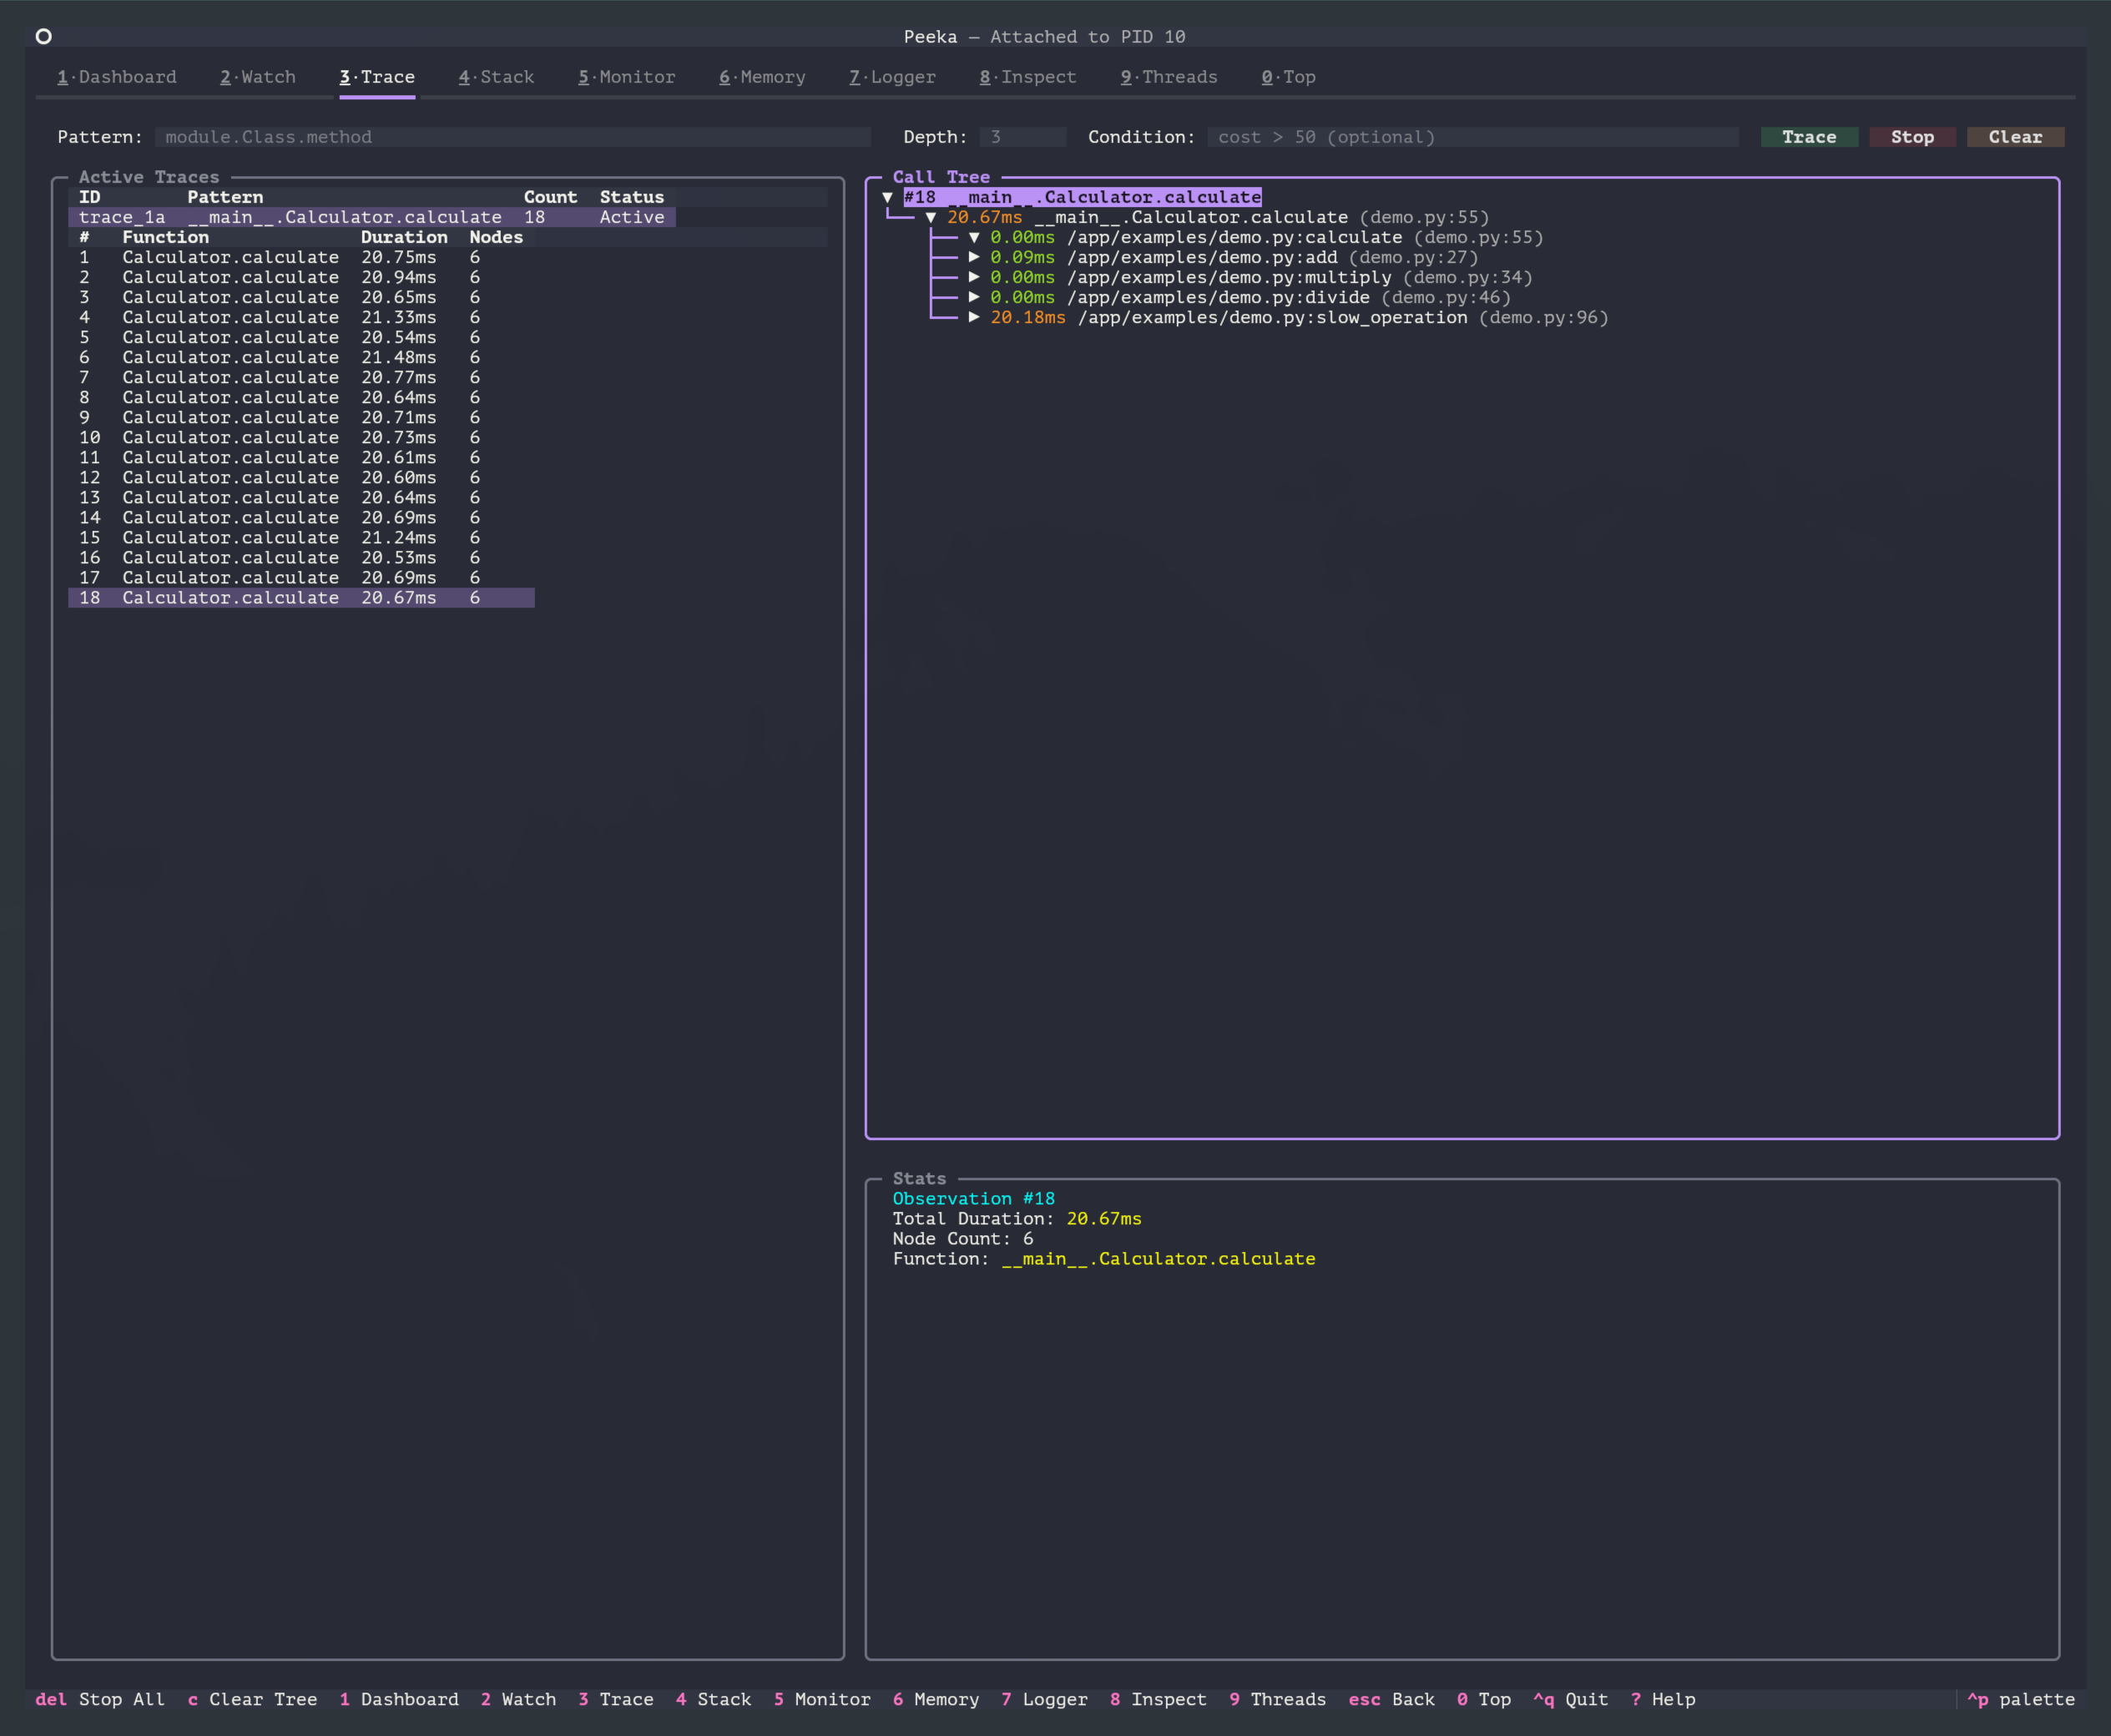
2. Visual Call Tree (TUI)
In TUI mode, the call tree is displayed as a visual tree structure:
Explanation:
- Active Traces on the left shows current trace tasks and per-observation timing
- Call Tree on the right shows the expandable/collapsible call tree
- Different colors highlight different timing ranges
- Stats at the bottom shows total duration, node count, and function name for the selected observation
3. Adjust Trace Depth
# Depth of 1: trace only direct calls
peeka-cli trace "service.process" -d 1

# Depth of 5: trace 5 levels of calls
peeka-cli trace "service.process" -d 5
Depth Comparison Example:
# Original call chain
process() → validate() → check_type() → isinstance()
  ├── query_db() → execute() → connect()
  └── format_result() → json.dumps()

# depth=1
process() → validate()
          → query_db()
          → format_result()

# depth=2
process() → validate() → check_type()
          → query_db() → execute()
          → format_result() → json.dumps()

# depth=3 (default)
process() → validate() → check_type() → isinstance()
          → query_db() → execute() → connect()
          → format_result() → json.dumps()
4. Conditional Filtering
# Only trace calls exceeding 50ms
peeka-cli trace "api.handler" --condition "cost > 50"

# Combine parameters and timing conditions
peeka-cli trace "service.query" --condition "cost > 100 and params[0] > 1000"
5. Skip Built-in Functions
# Default behavior: skip built-in functions (reduce output noise)
peeka-cli trace "mymodule.func"

# Show all calls (including built-in functions)
peeka-cli trace "mymodule.func" --skip-builtin=false
Built-in Function Examples:
- Python built-in functions:
len(),str(),isinstance(),print() - Standard library functions:
json.dumps(),os.path.join(),datetime.now()
Implementation Technology
Peeka’s trace command automatically selects the optimal implementation based on Python version:
Implementation Principles
Peeka’s trace command automatically selects the optimal implementation based on Python version:
| Python Version | Implementation | Performance Overhead | Notes |
|---|---|---|---|
| 3.12+ | sys.monitoring | < 5% | Official PEP 669 API, optimal performance |
| 3.8.1-3.11 | sys.settrace | < 20% | Good compatibility, auto-enabled |
gevent compatibility (v0.1.15+): when the target has gevent monkey patching or an active hub, trace degrades to the wrapper_only backend to avoid violating frame stack invariants with sys.settrace. This mode still reports target function observations, but it does not provide a recursive call tree.
sys.monitoring Implementation (Python 3.12+):
- Based on official monitoring API from PEP 669
- Uses
PY_STARTandPY_RETURNevents to capture calls - Performance overhead < 5%, recommended for production environments
- Automatically allocates tool_id, no conflicts with multiple observations
sys.settrace Implementation (Python 3.8.1-3.11):
- Uses Python’s built-in
sys.settrace()mechanism - Enabled only during target function execution (local trace)
- Performance overhead < 20%, fully usable in most scenarios
skip-builtin Filtering Mechanism:
- Checks
code.co_filename.startswith('<')to filter built-in functions (e.g.,<built-in>) - Checks Python standard library paths to filter stdlib functions
- Enabled by default, reduces output nodes by 50%+
Performance Impact
Performance Overhead
| Scenario | Overhead | Notes |
|---|---|---|
| Simple functions | < 5% | Python 3.12+ |
| Simple functions | < 20% | Python 3.8.1-3.11 |
| Complex call tree (depth 5) | 10-30% | Depends on Python version |
| High-frequency calls (>1000 QPS) | 20-50% | Recommend limiting observation count |
Explanation:
- Python 3.12+ uses
sys.monitoring, significantly reducing overhead - Deeper traces incur greater overhead
- Recommended to use conditional filtering and count limits in production
Performance Optimization Recommendations
- Limit trace depth
# Trace only 3 levels of calls peeka-cli trace "func" -d 3 - Skip built-in functions
# Enabled by default, reduces nodes by 50%+ peeka-cli trace "func" --skip-builtin - Use conditional filtering
# Only trace slow calls peeka-cli trace "func" --condition "cost > 100" - Limit observation count
# Observe only 10 times peeka-cli trace "func" -n 10 - Minimum duration filtering
# Record only sub-calls > 10ms
peeka-cli trace "func" --min-duration 10
Usage Examples
1. Identify Performance Bottlenecks
# Trace slow endpoints, find sub-calls with longest duration
peeka-cli trace "api.handler.process_request" --condition "cost > 100"
Output:
`---[1250ms] api.handler.process_request()
    +---[10ms] api.validator.check_params()
    +---[1200ms] database.query.execute()  ← Bottleneck here!
    |   +---[50ms] database.connection.connect()
    |   `---[1150ms] database.cursor.fetch_all()
    `---[20ms] api.formatter.to_json()
Conclusion: Database query consumes 96% of time, needs SQL optimization or index addition.
2. Analyze Recursive Calls
# Trace recursive function execution depth and timing
peeka-cli trace "algorithm.factorial" -d 10
Output:
`---[5.2ms] algorithm.factorial(n=5)
    `---[4.1ms] algorithm.factorial(n=4)
        `---[3.0ms] algorithm.factorial(n=3)
            `---[2.0ms] algorithm.factorial(n=2)
                `---[1.0ms] algorithm.factorial(n=1)
                    `---[0.1ms] algorithm.factorial(n=0)
3. Understand Code Execution Path
# Trace conditional branch execution paths
peeka-cli trace "service.business_logic" -n 1
Scenario A (normal flow):
`---[50ms] service.business_logic()
    +---[5ms] service.validate_input()
    +---[30ms] service.process_data()
    `---[10ms] service.save_result()
Scenario B (exception flow):
`---[20ms] service.business_logic()
    +---[5ms] service.validate_input()
    +---[10ms] service.handle_invalid_input()
    `---[3ms] service.log_error()
4. Compare Performance Before/After Optimization
# Before optimization
peeka-cli trace "converter.parse_json" -n 10 > before.jsonl

# After optimization
peeka-cli trace "converter.parse_json" -n 10 > after.jsonl

# Analyze timing changes
jq '.total_duration_ms' before.jsonl | awk '{sum+=$1; count++} END {print "Before:", sum/count, "ms"}'
jq '.total_duration_ms' after.jsonl | awk '{sum+=$1; count++} END {print "After:", sum/count, "ms"}'
5. Integrate into CI/CD
# Performance regression testing
#!/bin/bash
THRESHOLD=100  # Maximum allowed duration 100ms

peeka-cli attach $PID
RESULT=$(peeka-cli trace "critical.function" -n 50 | \
  jq -s 'map(select(.type == "observation")) | map(.total_duration_ms) | add / length')

if (( $(echo "$RESULT > $THRESHOLD" | bc -l) )); then
  echo "Performance regression detected: ${RESULT}ms > ${THRESHOLD}ms"
  exit 1
fi
Data Processing and Analysis
Process JSON with jq
# 1. Extract call tree
peeka-cli trace "func" | jq '.call_tree'

# 2. Calculate average duration
peeka-cli trace "func" -n 100 | jq '.total_duration_ms' | \
  awk '{sum+=$1; count++} END {print "avg:", sum/count, "ms"}'

# 3. Find slowest sub-call
peeka-cli trace "func" | jq '.call_tree | .. | objects | select(.duration_ms != null) | {function, duration_ms}' | \
  jq -s 'sort_by(.duration_ms) | reverse | .[0]'

# 4. Count call frequency
peeka-cli trace "func" -n 100 | jq '.call_tree | .. | objects | select(.function != null) | .function' | \
  sort | uniq -c | sort -rn

# 5. Generate flame graph data
peeka-cli trace "func" -n 1000 | jq -r '.call_tree | .. | objects | select(.function != null) | "\(.function) \(.duration_ms)"' > flamegraph.txt
Python Data Analysis
import json
import sys
from collections import defaultdict

# Count total duration and occurrences of sub-calls
stats = defaultdict(lambda: {"count": 0, "total_ms": 0})

for line in sys.stdin:
    data = json.loads(line)
    if data["type"] == "observation":
        def traverse(node):
            if "function" in node:
                stats[node["function"]]["count"] += 1
                stats[node["function"]]["total_ms"] += node.get("duration_ms", 0)

            for child in node.get("children", []):
                traverse(child)

        for root in data["call_tree"]:
            traverse(root)

# Sort by total duration
sorted_stats = sorted(stats.items(), key=lambda x: x[1]["total_ms"], reverse=True)

print("Top 10 Time-Consuming Functions:")
print(f"{'Function':<60} {'Count':>10} {'Total (ms)':>15} {'Avg (ms)':>12}")
print("-" * 100)

for func, stat in sorted_stats[:10]:
    avg_ms = stat["total_ms"] / stat["count"]
    print(f"{func:<60} {stat['count']:>10} {stat['total_ms']:>15.2f} {avg_ms:>12.2f}")
Run:
peeka-cli trace "module.func" -n 100 | python analyze_trace.py
Output:
Top 10 Time-Consuming Functions:
Function                                                      Count     Total (ms)      Avg (ms)
----------------------------------------------------------------------------------------------------
database.query.execute                                          100       12500.00       125.00
api.handler.process_request                                     100       15000.00       150.00
json.dumps                                                      500        1000.00         2.00
...
Common Issues
1. Insufficient Trace Depth
Problem: Call tree only shows 3 levels, but there are more levels in reality
Solution:
# Increase depth limit
peeka-cli trace "module.func" -d 10

# Note: Excessive depth increases performance overhead
2. Too Much Output Data
Problem: Contains many built-in function calls, output difficult to read
Solution:
# Skip built-in functions (enabled by default)
peeka-cli trace "module.func" --skip-builtin

# Record only calls > 10ms
peeka-cli trace "module.func" --min-duration 10

# Use conditional filtering
peeka-cli trace "module.func" --condition "cost > 50"
3. Excessive Performance Overhead
Problem: Application response slows down after enabling trace
Solution:
# 1. Reduce trace depth
peeka-cli trace "module.func" -d 2

# 2. Limit observation count
peeka-cli trace "module.func" -n 10

# 3. Use conditional filtering, trace only slow calls
peeka-cli trace "module.func" --condition "cost > 100"

# 4. Consider upgrading to Python 3.12+ for better performance
4. No Data Observed
Possible Causes:
- Function not called
- Function name spelling error
- Condition expression too strict
- Observation count limit reached (-n parameter)
Troubleshooting Steps:
# 1. Confirm function name is correct
python3 -c "import mymodule; print(mymodule.MyClass.my_method)"

# 2. Remove condition expression, observe once first
peeka-cli trace "mymodule.func" -n 1

# 3. Check if process exists
ps aux | grep <pid>
Advanced Tips
1. Generate Flame Graph
# Collect trace data
peeka-cli trace "module.func" -n 1000 > trace.jsonl

# Convert to flame graph format
jq -r '.call_tree | .. | objects | select(.function != null) | "\(.function);\(.duration_ms)"' trace.jsonl \
  > folded.txt

# Generate flame graph (requires flamegraph.pl installation)
flamegraph.pl folded.txt > flamegraph.svg
2. Compare Performance Across Versions
# Version A
git checkout v1.0
peeka-cli trace "module.func" -n 100 > trace_v1.jsonl

# Version B
git checkout v2.0
peeka-cli trace "module.func" -n 100 > trace_v2.jsonl

# Compare average duration
echo "v1.0: $(jq -s 'map(.total_duration_ms) | add / length' trace_v1.jsonl) ms"
echo "v2.0: $(jq -s 'map(.total_duration_ms) | add / length' trace_v2.jsonl) ms"
3. Automated Performance Monitoring
#!/usr/bin/env python3
"""Performance regression monitoring script"""
import json
import subprocess
import time

THRESHOLD = 100  # Maximum allowed duration (ms)
CHECK_INTERVAL = 3600  # Check interval (seconds)

def check_performance(pid, pattern):
    cmd = ["peeka-cli", "trace", pattern, "-n", "50"]
    proc = subprocess.Popen(cmd, stdout=subprocess.PIPE, text=True)

    durations = []
    for line in proc.stdout:
        data = json.loads(line)
        if data["type"] == "observation":
            durations.append(data["total_duration_ms"])

    avg_duration = sum(durations) / len(durations) if durations else 0

    if avg_duration > THRESHOLD:
        send_alert(f"Performance regression: {avg_duration:.2f}ms > {THRESHOLD}ms")

    return avg_duration

def send_alert(message):
    # Send alert (email, Slack, DingTalk, etc.)
    print(f"ALERT: {message}")

if __name__ == "__main__":
    pid = int(sys.argv[1])
    pattern = sys.argv[2]

    while True:
        duration = check_performance(pid, pattern)
        print(f"[{time.strftime('%Y-%m-%d %H:%M:%S')}] Avg duration: {duration:.2f}ms")
        time.sleep(CHECK_INTERVAL)
4. Integrate with Prometheus
from prometheus_client import Histogram, start_http_server
import json
import subprocess

# Define metrics
trace_duration = Histogram('trace_duration_ms', 'Function trace duration', ['function'])

# Start Prometheus server
start_http_server(8000)

# Collect trace data
proc = subprocess.Popen(
    ["peeka-cli", "trace", "module.func"],
    stdout=subprocess.PIPE,
    text=True
)

for line in proc.stdout:
    data = json.loads(line)
    if data["type"] == "observation":
        # Process call tree recursively
        def record_metrics(node):
            if "function" in node and "duration_ms" in node:
                trace_duration.labels(function=node["function"]).observe(node["duration_ms"])
            for child in node.get("children", []):
                record_metrics(child)

        for root in data["call_tree"]:
            record_metrics(root)
References
- PEP 669: Low Impact Monitoring for CPython
- PEP 669: Low Impact Monitoring for CPython
- Peeka Architecture Design
Changelog
| Version | Date | Updates |
|---|---|---|
| 0.2.0 | 2026-02 | Added trace command documentation |
| 0.1.0 | 2025-01 | Initial release |
Version History
| Version | Release Date | Changes |
|---|---|---|
| 0.1.17 | 2026-06-13 | Trace responses now carry runtime_meta (startup_backend, effective_backend, downgrade_reason) when degraded to the wrapper_only backend; the TUI Trace view surfaces Backend / Gevent state in the stats panel |
| 0.1.16 | 2026-06-07 | Added --client |
| 0.1.15 | 2026-05-27 | gevent patched/active hub runtimes degrade to the wrapper_only trace backend |
| 0.1.12 | 2026-05-08 | Unified TUI panel system, refined responsive layouts (commit 50c4af4) |
| 0.1.11 | 2026-05-07 | Client labeling with stable sources (commit 965ff22), enriched activity diagnostics (commit b1b0412) |
| 0.1.10 | 2026-05-04 | TUI button color normalization (commit fd6a0a1), improved activity log wrapping readability (commit 5f46ae8) |